
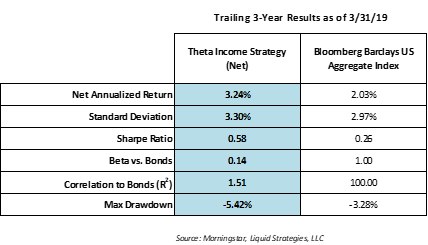
The Theta Income Strategy was able to capitalize on the normalization of volatility to generate a solid net return of 3.02% for the 1st quarter after an extremely challenging environment in 2018. On a longer-term basis, the Theta Income Strategy continues to provide compelling absolute and risk-adjusted returns relative to bonds.
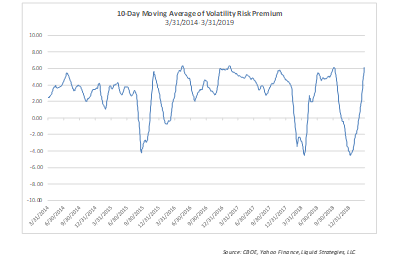
After an extreme “recalibration” of risk that took place in 2018, the market was able to quickly and efficiently normalize equity option pricing to adequately compensate option writers. This normalization drove the return to a solidly positive volatility risk premium environment. Previous letters described the importance of a positive volatility risk premium to the success of the Strategy, and that 2018 was the 2nd worst calendar year for this risk premium, with 2008 being the only year with a worse result. The chart below illustrates the past five years of the volatility risk premium, which has historically been positive in over 90% of the months and quarters going back to 1990.
The return attribution for the Theta Income Strategy was ideal for the quarter, with very similar contributions from the option writing portfolio and yield on the underlying bond portfolio. On a gross basis, the option writing portfolio contributed approximately 1.60% compared to a 1.68% contribution from the bond portfolio.
While we embrace the positive volatility risk premiums provided to us, it is a bit concerning how much volatility retreated during the quarter on an absolute basis. The ideal backdrop for us is a combination of high volatility risk premiums and elevated levels of absolute volatility levels. This combination allows for higher premiums to option writers along with a high probability of success. At the beginning of the quarter, 2018 appeared to have been a key inflection point between multi-year low-volatility and high-volatility regimes and that 2019 would likely have a higher level of baseline volatility. A higher level of baseline volatility (as measured by the CBOE Volatility Index or “the VIX”) could easily reach the upper teens or low twenties in such a regime. However, the VIX has since made its way back below 15, indicating a market expectation of a return to a relatively quiet market environment. Given all of the risk factors in the market for the next 12-18 months, it is very possible that market volatility has overshot to the downside as the market has become overly complacent. Since high volatility regimes tend to coincide with the approach/start of a recession, the market will be highly sensitive to any data or news that heightens the risk of a recession. As probabilities of a recession increase, so will volatility.
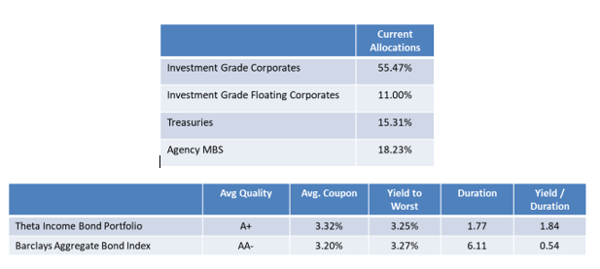
Bonds extended their strong rally that started in November of 2018. The continued strength can be attributed to a flight to quality sentiment on the heels of severe equity declines in Q4 2018 as well as the signaling of a more patient stance from the Federal Reserve. During the quarter, we were able to find pockets of opportunity to modestly extend duration in the portfolio, although we remain positioned significantly shorter duration relative to Bloomberg Barclays US Aggregate Bond Index.
Following is a breakdown of the composition of the bond portfolio as of 3/31/2019:
Not only was there equitable contribution from both the bond and option writing components of the strategy during the quarter, but the complementary nature of the two was quite prevalent. While many days during the quarter were pleasantly positive for both segments, during the more extreme periods of either falling equity markets or pullbacks in bonds the interaction effect between the two helped reduced drawdowns and dampen overall portfolio volatility.
At this point, it is impossible to tell whether 2018 was an extreme “blip” in a continuing low volatility regime or if Q1 was a short-term reprieve in the early stage of a high volatility regime. The Theta Income Strategy is designed to benefit from either of these possibilities, and can be an important part of investor portfolios over the coming years.
As always, we appreciate your continued support and interest.
Learn more about our offerings...


Important Disclosures
Past performance is no indication of future results. Inherent in any investment is the potential for loss. The adviser may not achieve the stated annual return objective. This commentary is not meant as a general guide to investing, nor as a source of any specific investment recommendations. This commentary makes no implied nor express recommendations concerning the manner in which any client’s accounts should or would be handled.
With regard to indices presented herein, please note the volatility of the indices may be materially different from the individual performance attained by a specific investor. In addition, the portfolio’s holdings may differ significantly from the securities that comprise the indices. The indices have not been selected to represent an appropriate benchmark to compare an investor’s performance, but rather are disclosed to allow for comparison of the investor’s performance to that of certain well-known and widely recognized indices. You cannot invest directly in an index.
Performance is presented net of fees and was calculated using standard management fees of 1.00% annually. For further details on fees, please refer to Part 2A of Adviser’s Form ADV. Inherent in any investment is the potential for loss. Past performance results are not necessarily indicative of future performance results.
The account’s performance has been compared to the following indices. Index returns illustrated would be lower if transaction costs and fees for asset management were deducted. Information regarding the index contained in this report is from sources deemed to be reliable however; the Adviser does not guarantee the accuracy or completeness of such information.
The investments and services to which this presentation relates are only available to persons with a categorization as a qualified client, as defined under Rule 205-3 of the Investment Adviser Act of 1940, and other persons should not act or rely on it.
S&P 500 Total Return Index - An index of 500 stocks chosen for market size, liquidity and industry grouping, among other factors. The S&P 500 is designed to be a leading indicator of U.S. equities and is meant to reflect the risk/return characteristics of large cap stocks. All cash distributions (e.g. dividends and income) are reinvested. Used as a proxy for "Stocks" above.
Barclay’s U.S. Aggregate Bond Index - A broad-based index of bond securities used to represent investment-grade bonds traded in the U.S. The index was formerly known as the “Lehman Aggregate Bond Index”. Used as a proxy for "Bonds" above.
CBOE Volatility Index ("VIX") - An index sponsored by the Chicago Board of Options Exchange (CBOE) that shows the market's expectation of 30-day volatility. It is constructed using the implied volatilities of various option expirations and various strike prices of S&P 500 index options.
Correlation (R2) - A statistical measure of how two financial instruments (e.g. securities, indices, etc.) move in relation to each other. A correlation of +1 implies that as one security moves, either up or down, the other security will move in lockstep, in the same direction. Alternatively, the closer correlation is to 0, the less the movements of two securities are related to one another.
Beta - A measure of the portfolio’s sensitivity to changes in the benchmark. A beta of 1 indicates the portfolio has historically moved with the benchmark. A portfolio beta greater than 1 indicates the portfolio has been more volatile than the benchmark and a portfolio beta less than one indicates the portfolio has been less volatile than the benchmark. Beta in this presentation is calculated using monthly historical returns.
Sharpe Ratio - A measure for calculating risk-adjusted return. The Sharpe ratio is the average return earned in excess of the risk-free rate per unit of volatility or total risk. Subtracting the risk-free rate from the mean return, the performance associated with risk-taking activities can be isolated. Sharpe ratio = (Mean portfolio return − Risk-free rate)/Standard deviation of portfolio return. For Sharpe Ratio calculations in this presentation, the “risk free rate” is represented by the annualized monthly returns of the 3 Month US T-Bill.
Max Drawdown - A measure of the largest single drop from peak to trough based on monthly portfolio returns
HFRX Absolute Return Index - A stock index designed to measure absolute returns. The absolute return index is actually a composite index made up of five other indexes. This index is used to compare the absolute returns posted by the hedge fund market as a whole against individual hedge funds.
Standard Deviation - A measure of the dispersion of a set of data from its mean.
