
Some of the best investment opportunities appear during peak pessimism. Investors that can stomach volatility during times of extreme stress can be rewarded handsomely, particularly if they are able to add new capital into risk assets as others liquidate holdings indiscriminately. While these points may appear somewhat obvious when discussing major risk assets, the same holds true for our Overlay strategy. The Overlay strategy is designed to produce positive returns in rising, flat and modestly lower markets, but it is expected to have negative returns during periods of high volatility and rapidly falling equity markets. Just as recessions are a necessary phase of economic cycles, periods of negative returns in the Overlay are occasionally necessary to reinforce the strong positive risk premium that we are able to capitalize on in the long term. Similar to the opportunities created in major risk assets in times like this, we expect significant opportunities for the Overlay strategy once the market stabilizes. Missing the recovery phase in risk assets (and in the Overlay) could have a significant negative impact on portfolios in the form of opportunity cost. This note is intended to 1) provide data on how costly being out of the Overlay strategy can be when the market recovers; 2) provide context as to how this volatility cycle compares to previous ones; and 3) identify potential green shoots to look for over the coming months.
Cost of Being Out of the Market
Advisors have started to dust off the classic charts that illustrate the cost of being out of the market at the wrong time, given the fact that a significant portion of long-term returns in risk assets can be concentrated in relatively short trading windows. Since market timing is impossible, the point of these charts is to convey the message to stay invested even when it feels bad to do so.
We employ a conservative, asset-secured put writing strategy to seek incremental returns for investors. Cash-secured put writing strategies have the same dynamic where a significant portion of the returns come when the market recovers from a bear market. The two most common put writing indices are the CBOE S&P 500 Put Write Index (PUT) and the CBOE S&P 500 Weekly Put Write Index, with the difference between the two being the duration of the put options sold (PUT is ~ 30 days while WPUT is ~ 9 days). Blended these indices equally provides us with over 15 years of data to analyze. The results favor those investors that stayed in the strategy at times of peak fear (It is important to note that our Overlay strategy is considerably more conservative than either of these indices having delivered a max drawdown of just -5.7% vs. -19.0% and -20.7% for the WPUT and PUT indices respectively since launching the approach in November of 2013).
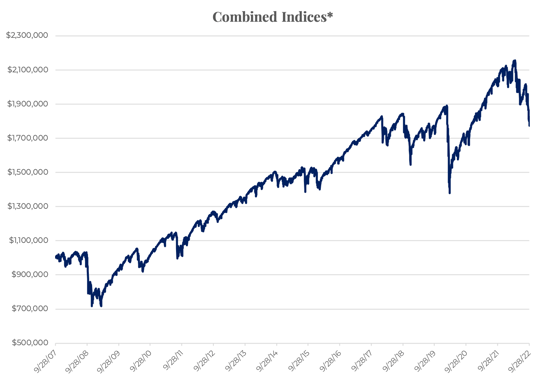
* Based on the daily returns of an equal blend of PUT and WPUT. Source: CBOE.com and Liquid Strategies, LLC
As the chart shows, the indices had material losses during times of extreme stress, but the recovery of those losses and the further gains after that have been impressive. After the Great Financial Crisis where fear and pessimism were extreme to say the least, the strategies had 8 solid years of returns with occasional modest pullbacks. Similarly, the indices recovered sharply following the initial wave of volatility relating to the pandemic. For investors with a long-term focus that are able to ride out short to intermediate-term volatility have been rewarded, while those that pulled out at the wrong time or attempted to market time may have had a very different experience. The following data points illustrate just how different that experience might have been.
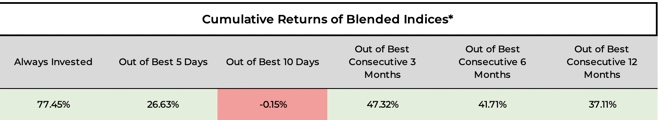
* Based on the daily returns of an equal blend of PUT and WPUT from 9/28/2007 to 9/30/2022. Source: CBOE.com and Liquid Strategies, LLC
Our expectation is that investors that remain in the strategy over the long-term will be rewarded. It is important to note that these best days and months came after major equity bottoms which most often coincides with above average volatility as measured by the VIX Index.
We can create a closer comparison to our Overlay put-spread strategy by using a combination of the CBOE 2% OTM PutWrite Index which calculates returns from selling 2% out-of-the-money put options on the S&P 500 and the CBOE 5% OTM Put Protection Index which involves the purchase of a 5% out-of-the-money put option on the S&P 500. The combination creates a 3% wide out-of-the-money put spread.
Since 1990, there have been 73 months when the VIX Index has had an ending value above 25. In the 6 months following those instances, a this put spread index has delivered positive returns in nearly 80% of the observations averaging 2.7% of incremental return generation with 43 of those observances delivering 3% or higher returns (see chart below).
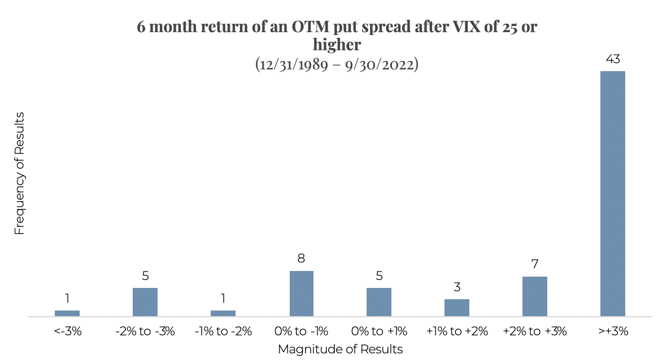
Past performance is not an indicator of future results. Returns are calculated on a gross of fee basis. Calculations reflect a combination of the CBOE 2% OTM PutWrite Index with the CBOE 5% OTM Put Protection Index less the S&P 500 Index. Calculations are based on monthly returns.
While periods of negative returns can be difficult to stomach, investors who are able to stay the course are often rewarded with a quicker recovery from the market lows.
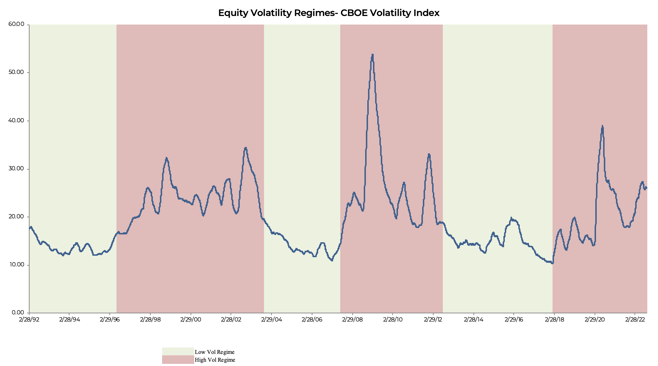
Historical Volatility Regimes
The equity market tends to cycle through periods of low volatility and high volatility, and these cycles are tied directly to levels of market uncertainty (uncertainty drives volatility higher). The high volatility cycles help to shake out excess leverage and speculation in the markets and creates more attractive long-term investment opportunities. The Overlay strategy is expected to perform well in a wide variety of market environments with the key exception of times when the market is falling sharply and volatility is rising sharply. This tends to coincide with the first phase of high volatility regimes where uncertainty is extreme. Historically, the second phase of high volatility regimes has created attractive opportunities for the Overlay as volatility subsides (but is still high enough to pay attractive premiums to investors) and the equity markets stabilize. Furthermore, low volatility regimes also tend to be supportive for the Overlay despite lower option premiums that we can collect, as the frequency and magnitude of market declines is relatively low. Volatility regimes tend to last about 5 years with the current high volatility regime at about 4.5 years, making it reasonable to assume that volatility should begin to subside in the coming quarters, although it obviously impossible to predict exactly when the shift will happen. If history is any guide, this shift will likely happen as most investors are still at peak fear levels as the markets begin their climb out of a “wall of worry.”
One way to think about volatility is the frequency of times the market moves +- 1%. As the chart below shows, 2022 is on track to possibly be in the top 5 in the number of days where the market has made such a move. Similar to the volatility regime chart above, these high volatility years tend to come in cycles, with the years between being relatively quiet.
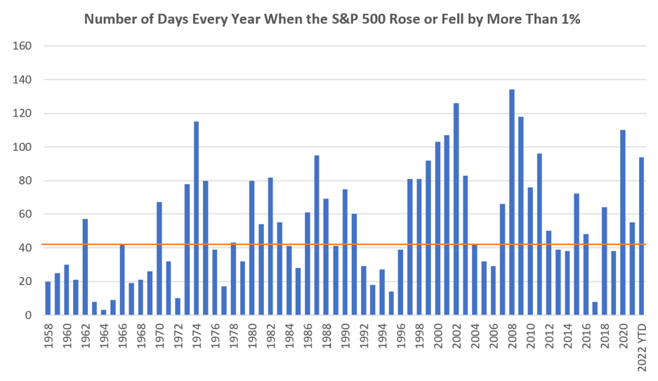
Source: DataTrek
Signs of Green Shoots
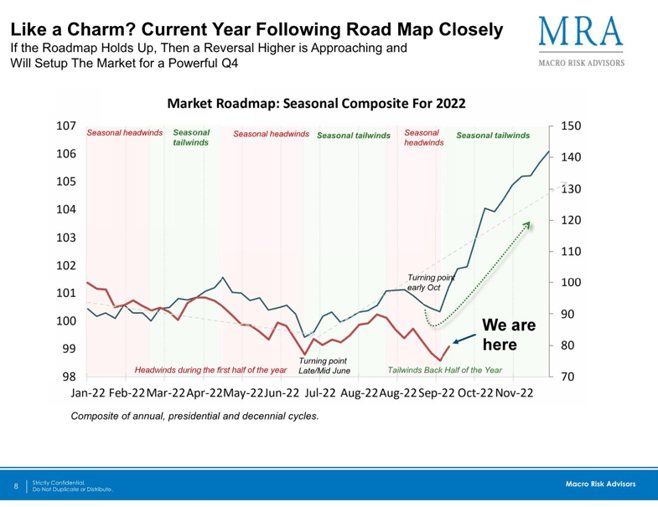
The chart below provides a very interesting roadmap for how seasonality tends to impact market returns. As it shows, seasonality is supportive of a positive Q4.
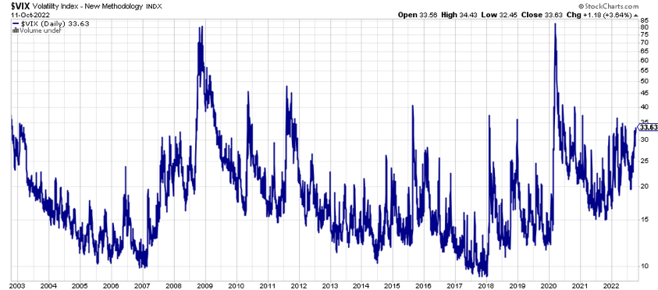
The CBOE Volatility Index (“the VIX”) tends to not stay above 30 for long and any spikes above 40 tend to be short-lived and associated with major market bottoms. Equity volatility has repeatedly pushed into the mid-30s in 2022, but when the range of expectations of investors compresses, so will equity volatility.
Setting Proper Expectations
The Overlay strategy takes advantage of market dynamics that have been in place for over 3 decades, where investors chronically overpay for downside market protection. Similar to the model of insurance companies, the strategy 1) has a high probability of success; 2) is expected to produce positive results in a wide variety of markets; and 3) will occasionally experience periods with above average losses. The periods of losses are essential to keeping this opportunity alive, as investors would never pay much, if anything, for downside market protection if the market was always quiet. It is reasonable to expect that every 4-6 years, the environment for the Overlay strategy will be extremely tough. It is during these times where our risk management protocols help to limit losses as generating positive returns is more difficult. It is the positive years in between these cycles that should allow the Strategy to generate sufficient returns to not only offset short-term losses, but provide a positive long-term incremental return to investors. We believe that we are in the late stages of the current high volatility regime, and as such, long-term investors should be more comfortable increasing allocations to the Strategy with the understanding that there may be more short-term volatility. While it may be tempting to wait to invest in or add to the Overlay until the markets feel good again, that feeling may not come until 6-12 months into a market recovery, during which time there will likely be a meaningful opportunity cost for waiting.
The assertions and statements in this blog post are based on the opinions of the author and Liquid Strategies. The examples cited in this paper are based on hypothetical situations and should only be considered as examples of potential trading strategies. They do not take into consideration the impact that certain economic or market factors have on the decision making process. Past performance is no indication of future results. Inherent in any investment is the potential for loss.
