
After a strong start in the first two months of the quarter, risk assets finally began to show signs of weakness in the final month. The choppy end of September caused the Overlay Strategy to finish the quarter with a modest loss of -0.11% on a gross basis, bringing the YTD gross incremental return generated by the Strategy to 2.42%. Over the long-term, this alpha source has provided a source of outperformance to create compelling long-term performance for the Overlay Strategies. For the quarter, the beta portion of the strategies produced mixed results, as large cap equities, core bonds and short-duration bonds produced modestly positive returns while small-cap equities and non-US equities both produced moderate losses for the month.
ANNUALIZED SEPARATE ACCOUNT ILLUSTRATIVE RETURNS (Net1)
11/01/2013 - 09/30/2021
| Q3 | 1 YEARS | 3 YEARS | 5 YEARS | Inception to Date | |
| Large Cap Equity Strategy | 0.19% | 33.25% | 15.71% | 18.20% | 16.39% |
| S&P 500 Index | 0.58% | 30.00% | 15.99% | 16.90% | 14.23% |
| Small Cap Equity Strategy | -3.23% | 61.29% | 9.07% | 14.83% | 13.57% |
| S&P 600 Index | -2.84% | 57.64% | 9.44% | 13.57% | 11.48% |
| Foreign Equity Strategy | -0.99% | 16.15% | 4.17% | 6.85% | 7.36% |
| MSCI ACWI ex US MinVol | -2.99% | 23.92% | 8.03% | 8.94% | 5.15% |
| Core Bond Strategy | -0.32% | 1.73% | 5.52% | 2.94% | 5.54% |
| Bbg Barc US Aggregate Index | 0.05% | -0.90% | 5.36% | 2.94% | 3.28% |
| Short Term Bond Strategy | -0.28% | 3.94% | 4.46% | 4.39% | 4.93% |
| Bbg Barc US Corp 1-5 Yr TR | 0.09% | 1.08% | 4.25% | 2.85% | 2.62% |
| Municipal Bond Strategy | -0.75% | 4.88% | 4.99% | 4.42% | 5.99% |
| Bbg Barc Muni Bond Index | -0.27% | 2.63% | 5.06% | 3.26% | 4.05% |
1Net of fees assumes a 0.75% management fee applied monthly. The three, five and ITD are shown annualized. These returns are illustrative, hypothetical numbers representative of two actual return streams (Liquid Strategies Overlay and the underlying index ETF). The numbers illustrate what would have happened had we taken the underlying index ETF returns and added Liquid Strategy Overlay returns to them. Source: Morningstar, Liquid Strategies.
HEDGED LARGE CAP EQUITY SINCE INCEPTION RETURNS (Net1)
06/30/2019 - 09/30/2021
| Inception to Date | |
| Annualized Return (Net) | 16.97% |
| Annualized Volatility | 9.59% |
| Sharpe Ratio | 1.62 |
| Max Drawdown | -6.23% |
| Beta vs S&P 500 | 0.48 |
| Up Capture | 65.89% |
| Down Capture | 46.26% |
OVERLAY STRATEGY ANNUALIZED PERFORMANCE
11/01/2013 - 09/30/2021
| Q3 | 1 YEARS | 3 YEARS | 5 YEARS | Inception to Date | |
| Overlay Strategy (Gross) | -0.11% | 3.50% | 0.94% | 2.24% | 3.01% |
| Overlay Strategy (Net) | -0.30% | 2.73% | 0.19% | 1.48% | 2.24% |
Net of fees assumes a 0.75% management fee applied monthly.
*Hypothetical/Illustrative performance is not an indicator of future actual results. The results reflect performance of a strategy not offered to investors during the time indicated in the analysis and do not represent returns that any investor actually attained. Hypothetical/Illustrative results are calculated by the retroactive application of the Overlay strategy constructed on the basis of historical data combined with other existing independently-managed ETFs and based on assumptions integral to this presentation which may or may not be testable and are subject to losses. General assumptions include: The manager would have been able to purchase securities in a single portfolio with similar characteristics to the Overlay Strategy and the Index ETFs recommended by the illustration, and the markets were sufficiently liquid to permit all trading. Indexes used for comparative purposes cannot be traded, however there are securities, funds, and similar investments that can be purchased to obtain similar results and include no fees. Changes in these assumptions may have a material impact on the hypothetical returns presented. No representations and warranties are made as to the reasonableness of the assumptions. This information is provided for illustrative purposes only. Actual performance may differ significantly from hypothetical/illustrative performance. Source: Morningstar, Bloomberg, L.P., Liquid Strategies.
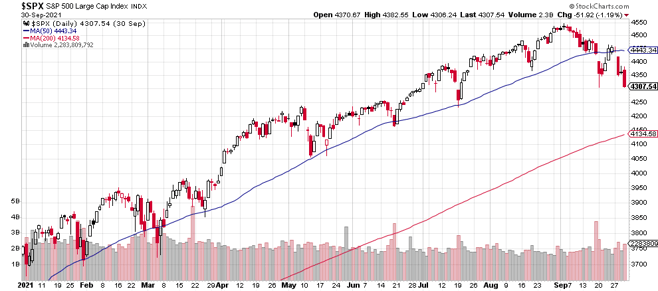
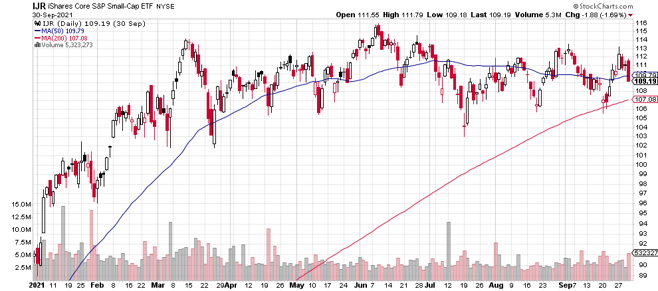
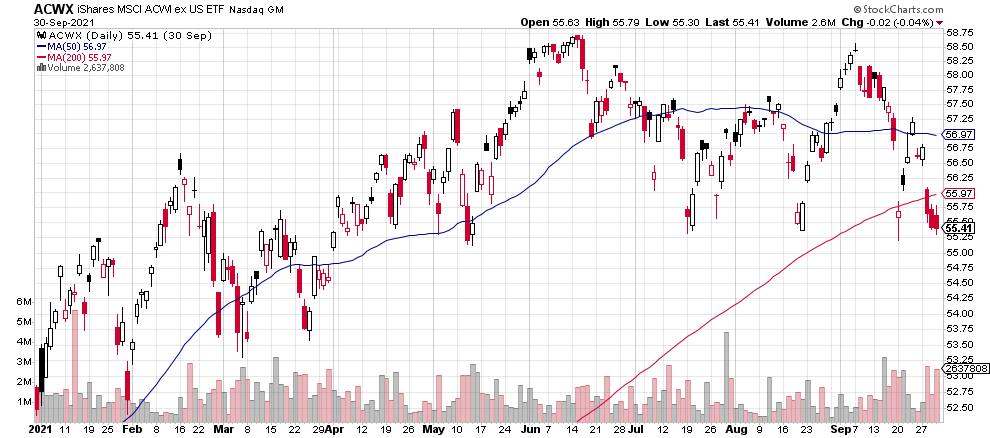
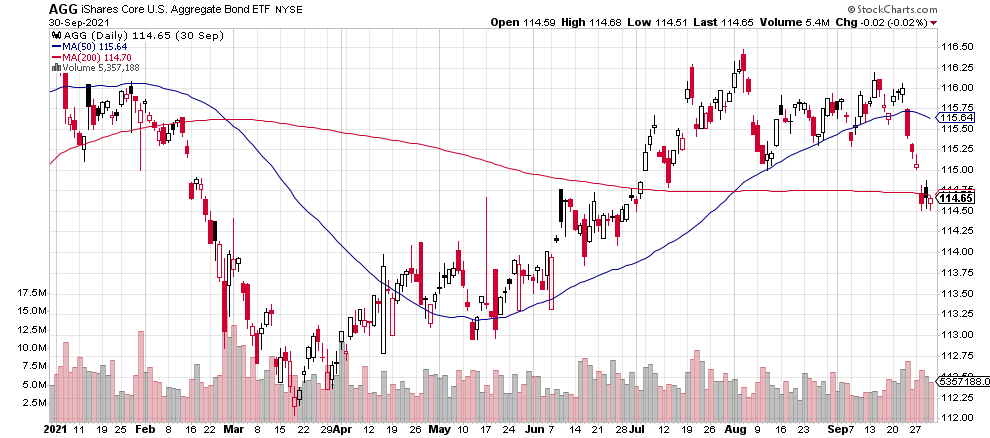
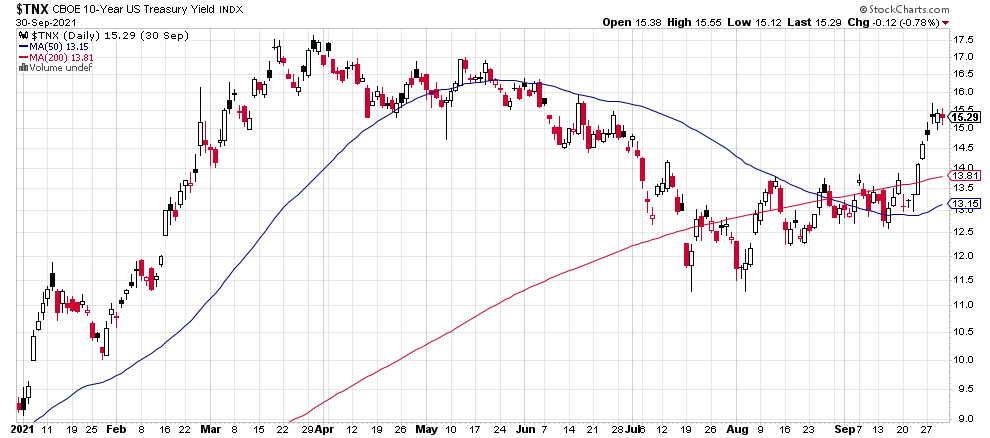
A few factors contributed to the late weakness in the quarter. First, a wall of worry continued to build over the past couple of quarters as more concerns piled on to existing ones, with fears of a U.S. debt default being the most recent one. While risk assets tend to “climb a wall of worry,” if other factors serve as additional headwinds, these worries can turn into reasons to sell and take profits. Second, seasonality can often have a big impact, as investors have been trained to fear the August-October time frame given some of the historically high volatility. The final factor that helped to enhance the impact of the first two factors, was that risk assets broke through widely followed technical support levels. Similar to seasonality, breaches of key technical support levels can be a self-fulfilling factor, as many traders will take down exposure when their perceived support levels are broken. As an example in the case of the S&P 500 Index, since the middle of November of 2020, the index would often test the support provided by the 50-day moving average and would bounce off of that point and continue to grind higher. In September, however, this key level was decisively broken and after a brief oversold bounce, the S&P 500 Index headed lower once again. Small-cap and non-US equities have been showing signs of fatigue for much longer. The S&P 600 Small-Cap Index and ACWI ex-US both peaked in early June and have since been trading in a fairly volatile manner within a pretty clear range, struggling to mount a sustained rally. Core bonds also got off to a positive start in the quarter, but renewed inflation fears, likely caused by a combination of concerns about supply chain issues and labor shortages, drove interest rates higher at the end of the quarter, reversing most quarterly gains.
As this letter goes to press, the debt ceiling limit issue has been kicked down the road until December, but still gives investors something to worry about at some point (although the actually probability of a debt default should be viewed as extremely small). With this issue temporarily pushed aside, the markets will now likely focus on the cost pressures that businesses are facing caused by supply chain and labor problems, and whether these cost increases will be passed on to consumers in a significant way. If these costs are not passed on to consumers, sustained higher costs would lead to margin compression, which would lead investors to challenge their valuation assumptions. If they are able to pass these costs to the consumers, there would be a smaller impact on corporate margins, but it is hard to tell in this environment what the elasticity of demand is to rapidly rising prices. Either way, rapidly rising prices would likely have a negative impact on both corporations and consumers, putting the Fed in a challenging position where they may have to react with rate hikes far earlier than they thought. If the FOMC stops the use of the word “transitory” in the description of current inflation, it may signal that they feel that inflation is becoming a longer-term problem. Another wild card relating to supply chain issues and labor issues is the potential impact on consumer spending. Low/no inventory of goods that consumers want (anyone that has tried to buy a car recently can relate to this) is opportunity missed by companies which could have a temporary (or longer) impact on the top line. In the service sector, labor shortages are causing significant declines in service quality in restaurants and stores. Businesses that cannot provide adequate staffing face the risk of permanently losing customer loyalty.
Despite all of this uncertainty, most investors still seem to believe that stocks are the only place to be with interest rates and corporate spreads at such low levels. An interest rate driven sell off in stocks due to rapidly rising rates would also cause corporate bonds to fall in lockstep. A simultaneous selloff in stocks and bonds would foster a significant increase in volatility across all risk assets. However, until investors see more of a clear path to “runaway” inflation and thus a rapid series of rate hikes, investors will continue to look to buy the dips out of fear of missing the next move higher. So far, these market concerns have resulted in higher levels of premiums that we have been able to collect in the Overlay Strategy, better positioning us to withstand/benefit from market volatility.
As always, we would like to extend an open invitation to serve as a resource for anyone that would like to discuss our views on the markets, particularly as it relates to the relationship between volatility and risk assets. We appreciate your continued support and interest.

Shawn Gibson, CIO, Portfolio Manager
Adam Stewart, CFA, Portfolio Manager
Justin Boller, CFA, Portfolio Manager
The assertions and statements in this blog post are based on the opinions of the author and Liquid Strategies. The examples cited in this paper are based on hypothetical situations and should only be considered as examples of potential trading strategies. They do not take into consideration the impact that certain economic or market factors have on the decision making process. Past performance is no indication of future results. Inherent in any investment is the potential for loss.
