
In our previous letter, we described Q1 as a period of "risk recalibration" where all risk assets had to adjust to a far more uncertain and risky outlook. This process continued into the 2nd quarter with both equities and bonds taking significant 3-month losses (-16.11% for the S&P 500 Index and -4.69% for the Bloomberg Barclays US Aggregate Bond Index). The risk controls built into the Overlay strategy once again helped to limit the magnitude of losses, resulting in a gross loss of -1.89% for Q2, bringing the YTD gross return to -2.64% (compared to -19.96% for the S&P 500 Index and -10.35% for the Bloomberg Barclays US Aggregate Bond Index). As the quarter came to a close, there was evidence that the risk recalibration that has rocked the markets may be in the late stages, leading us to be optimistic that the market conditions may soon be very supportive for the Strategy.
ANNUALIZED SEPARATE ACCOUNT ILLUSTRATIVE RETURNS (Net1)
11/01/2013 - 06/30/2022
| Q2 | 1 YEARS | 3 YEARS | 5 YEARS | Inception to Date | |
| Large Cap Equity Strategy | -18.01% | -13.04% | 11.30% | 10.95% | 13.01% |
| S&P 500 Index | -16.11% | -10.64% | 10.60% | 11.30% | 11.38% |
| Small Cap Equity Strategy | -16.02% | -19.13% | 7.96% | 6.86% | 10.03% |
| S&P 600 Index | -14.11% | -16.81% | 7.30% | 7.20% | 8.48% |
| Foreign Equity Strategy | -12.28% | -15.79% | -0.66% | 1.16% | 4.72% |
| MSCI ACWI ex US MinVol | -13.73% | -19.42% | 1.35% | 2.50% | 2.48% |
| Core Bond Strategy | -6.62% | -12.44% | -0.03% | 0.88% | 3.49% |
| Bbg Barc US Aggregate Index | -4.69% | -10.29% | -0.93% | 0.88% | 1.70% |
| Short Term Bond Strategy | -3.99% | -8.38% | 1.21% | 1.44% | 3.48% |
| Bbg Barc US Corp 1-5 Yr TR | -1.94% | -6.14% | 0.38% | 1.49% | 1.80% |
| Municipal Bond Strategy | -4.61% | -9.86% | 0.90% | 1.56% | 4.29% |
| Bbg Barc Muni Bond Index | -2.94% | -8.57% | -0.18% | 1.51% | 2.66% |
1Net of fees assumes a 0.75% management fee applied monthly. The three, five and ITD are shown annualized. These returns are illustrative, hypothetical numbers representative of two actual return streams (Liquid Strategies Overlay and the underlying index ETF). The numbers illustrate what would have happened had we taken the underlying index ETF returns and added Liquid Strategy Overlay returns to them. Source: Morningstar, Liquid Strategies.
HEDGED LARGE CAP EQUITY SINCE INCEPTION RETURNS (Net1)
06/30/2019 - 06/30/2022
| Inception to Date | |
| Annualized Return (Net) | 9.00% |
| Annualized Volatility | 11.40% |
| Sharpe Ratio | 0.76 |
| Max Drawdown | -16.26% |
| Beta vs S&P 500 | 0.56 |
| Up Capture | 66.55% |
| Down Capture | 58.63% |
OVERLAY STRATEGY ANNUALIZED PERFORMANCE
11/01/2013 - 06/30/2022
| Q2 | 1 YEARS | 3 YEARS | 5 YEARS | Inception to Date | |
| Overlay Strategy (Gross) | -1.89% | -1.60% | 1.71% | 0.83% | 2.57% |
| Overlay Strategy (Net) | -2.07% | -2.34% | 0.95% | 0.07% | 1.80% |
Net of fees assumes a 0.75% management fee applied monthly.
*Hypothetical/Illustrative performance is not an indicator of future actual results. The results reflect performance of a strategy not offered to investors during the time indicated in the analysis and do not represent returns that any investor actually attained. Hypothetical/Illustrative results are calculated by the retroactive application of the Overlay strategy constructed on the basis of historical data combined with other existing independently-managed ETFs and based on assumptions integral to this presentation which may or may not be testable and are subject to losses. General assumptions include: The manager would have been able to purchase securities in a single portfolio with similar characteristics to the Overlay Strategy and the Index ETFs recommended by the illustration, and the markets were sufficiently liquid to permit all trading. Indexes used for comparative purposes cannot be traded, however there are securities, funds, and similar investments that can be purchased to obtain similar results and include no fees. Changes in these assumptions may have a material impact on the hypothetical returns presented. No representations and warranties are made as to the reasonableness of the assumptions. This information is provided for illustrative purposes only. Actual performance may differ significantly from hypothetical/illustrative performance. Source: Morningstar, Bloomberg, L.P., Liquid Strategies.
The main driver of market volatility is uncertainty, particularly as it relates to the range of future potential economic and earnings outcomes. A great way to gauge the market perception of how wide the range of future outcomes are is the "VIX" (the CBOE S&P 500 Volatility Index), which is impacted both by recent market volatility as well as expectations for volatility going forward. During quiet markets with stable growth and stable inflation, the range of future outcomes is narrower, causing the VIX to remain at low levels. As uncertainty around economic growth and inflation increases, the range of outcomes widen, causing the VIX to increase as investors price in future volatility. In 2022, this uncertainty, and thus the potential range of outcomes, spiked to extreme levels as investors attempt to process the impact of anti-inflationary monetary policy after so many years of easy monetary policy. During these times, it is normal for investors to envision extremely adverse outcomes, causing the VIX to stay elevated for extended periods of time.
During periods like this the visibility of future outcomes eventually becomes clearer, causing the expected range of outcomes to narrow. The VIX is a good barometer for tracking this evolution. In particular, the volatility of the VIX can be a great indicator of sentiment. When uncertainty is high, not only does the VIX move the high levels, the day-to-day movement of the VIX become much more extreme as the market recalibrates risk. Eventually, this volatility in the VIX subsides as investors become more comfortable that the market is properly pricing in future risk.
As the charts below show, not only has the VIX appeared to have found a short-term ceiling but the volatility of the VIX has collapsed since the first quarter.
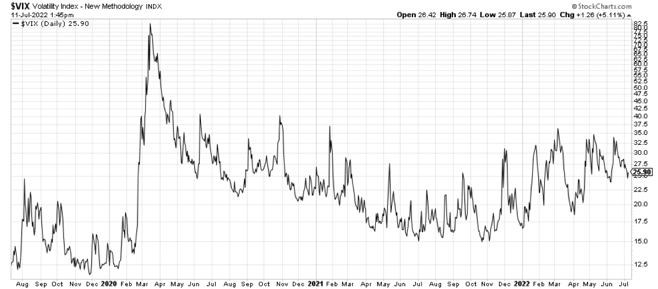
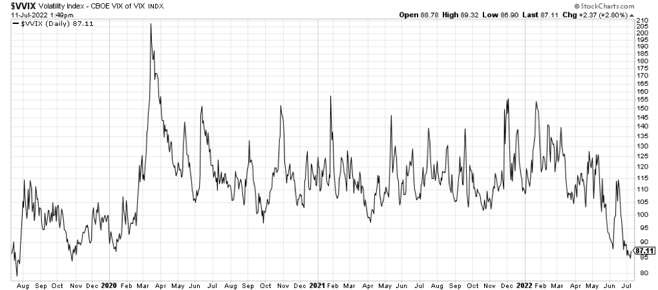
While these indicators alone are not enough to conclude that we have reached THE bottom, when combined with the extreme negative consumer and investors sentiment readings and other technical factors in the market, any good news that leads investors to shift the potential range of outcomes to the positive could provide a catalyst for a strong rally. With so much negativity being priced into the markets, it wouldn't take a lot to entice true buyers (not just short covers) to return to the market. Conversely, a combination of worse than expected inflation and growth could move the potential range of outcomes to the negative, raising the odds of another risk recalibration.
It is impossible tell when all of this volatility will end, but when it does, the stage might be set for multi-year tailwinds for the Overlay strategy, as the markets stabilize and the premiums we are able to collect should remain elevated for an extended period.
We appreciate your continued support and interest.

Shawn Gibson, Founding Member
Adam Stewart, CFA, Portfolio Manager
Justin Boller, CFA, Portfolio Manager
The assertions and statements in this blog post are based on the opinions of the author and Liquid Strategies. The examples cited in this paper are based on hypothetical situations and should only be considered as examples of potential trading strategies. They do not take into consideration the impact that certain economic or market factors have on the decision making process.
Important Disclosures
Past performance is no indication of future results. Inherent in any investment is the potential for loss. The adviser may not achieve the stated annual return objective. This commentary is not meant as a general guide to investing, nor as a source of any specific investment recommendations. This commentary makes no implied nor express recommendations concerning the manner in which any client’s accounts should or would be handled.
With regard to indices presented herein, please note the volatility of the indices may be materially different from the individual performance attained by a specific investor. In addition, the portfolio’s holdings may differ significantly from the securities that comprise the indices. The indices have not been selected to represent an appropriate benchmark to compare an investor’s performance, but rather are disclosed to allow for comparison of the investor’s performance to that of certain well-known and widely recognized indices. You cannot invest directly in an index.
Performance is presented net of fees and was calculated using standard management fees of 1.00% annually. For further details on fees, please refer to Part 2A of Adviser’s Form ADV. Inherent in any investment is the potential for loss. Past performance results are not necessarily indicative of future performance results.
The account’s performance has been compared to the following indices. Index returns illustrated would be lower if transaction costs and fees for asset management were deducted. Information regarding the index contained in this report is from sources deemed to be reliable however; the Adviser does not guarantee the accuracy or completeness of such information.
The investments and services to which this presentation relates are only available to persons with a categorization as a qualified client, as defined under Rule 205-3 of the Investment Adviser Act of 1940, and other persons should not act or rely on it.
S&P 500 Total Return Index - An index of 500 stocks chosen for market size, liquidity and industry grouping, among other factors. The S&P 500 is designed to be a leading indicator of U.S. equities and is meant to reflect the risk/return characteristics of large cap stocks. All cash distributions (e.g. dividends and income) are reinvested. Used as a proxy for "Stocks" above.
Barclay’s U.S. Aggregate Bond Index - A broad-based index of bond securities used to represent investment-grade bonds traded in the U.S. The index was formerly known as the “Lehman Aggregate Bond Index”. Used as a proxy for "Bonds" above.
CBOE Volatility Index ("VIX") - An index sponsored by the Chicago Board of Options Exchange (CBOE) that shows the market's expectation of 30-day volatility. It is constructed using the implied volatilities of various option expirations and various strike prices of S&P 500 index options.
Correlation (R2) - A statistical measure of how two financial instruments (e.g. securities, indices, etc.) move in relation to each other. A correlation of +1 implies that as one security moves, either up or down, the other security will move in lockstep, in the same direction. Alternatively, the closer correlation is to 0, the less the movements of two securities are related to one another.
Beta - A measure of the portfolio’s sensitivity to changes in the benchmark. A beta of 1 indicates the portfolio has historically moved with the benchmark. A portfolio beta greater than 1 indicates the portfolio has been more volatile than the benchmark and a portfolio beta less than one indicates the portfolio has been less volatile than the benchmark. Beta in this presentation is calculated using monthly historical returns.
Sharpe Ratio - A measure for calculating risk-adjusted return. The Sharpe ratio is the average return earned in excess of the risk-free rate per unit of volatility or total risk. Subtracting the risk-free rate from the mean return, the performance associated with risk-taking activities can be isolated. Sharpe ratio = (Mean portfolio return − Risk-free rate)/Standard deviation of portfolio return. For Sharpe Ratio calculations in this presentation, the “risk free rate” is represented by the annualized monthly returns of the 3 Month US T-Bill.
Max Drawdown - A measure of the largest single drop from peak to trough based on monthly portfolio returns
HFRX Absolute Return Index - A stock index designed to measure absolute returns. The absolute return index is actually a composite index made up of five other indexes. This index is used to compare the absolute returns posted by the hedge fund market as a whole against individual hedge funds.
Standard Deviation - A measure of the dispersion of a set of data from its mean.
