
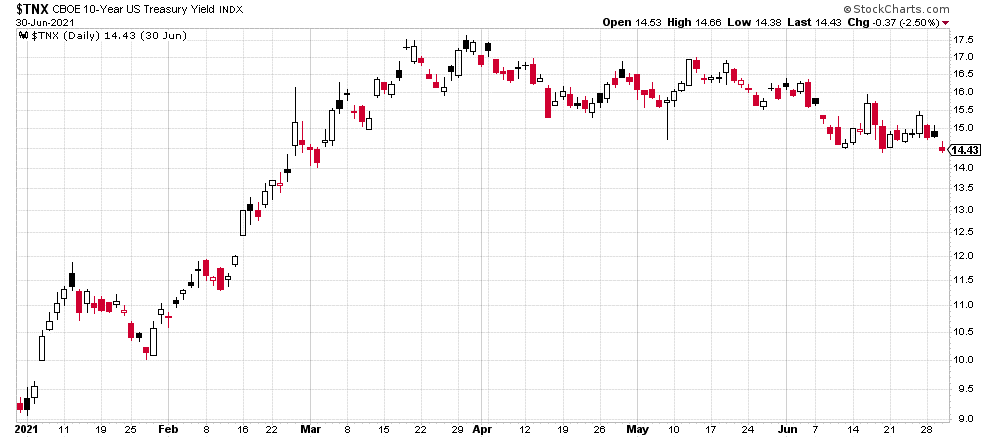
Despite some small speed bumps, equity markets continued to grind higher in the 2nd quarter, fueled by a very patient FOMC that continues to support easy monetary policy and appears prepared to let the economy/inflation run hot for a period of time. However, inflation fears subsided during the quarter, leading interest rates to stabilize after a powerful move higher in the first four months of the year. This environment was very supportive of the Overlay component of our strategies, adding approximately 1.50% in gross incremental return for the quarter, bringing the YTD gross incremental return to 2.53%. This alpha source continues to provide a source of outperformance and compelling long-term performance for the Overlay strategies.
ANNUALIZED SEPARATE ACCOUNT ILLUSTRATIVE RETURNS (Net1)
11/01/2013 - 06/30/2021
| Q2 | 1 YEARS | 3 YEARS | 5 YEARS | Inception to Date | |
| Large Cap Equity Strategy | 9.76% | 46.62% | 19.36% | 19.43% | 16.94% |
| S&P 500 Index | 8.55% | 40.78% | 18.67% | 17.64% | 14.63% |
| Small Cap Equity Strategy | 5.68% | 74.13% | 12.89% | 17.55% | 14.54% |
| S&P 600 Index | 4.50% | 67.40% | 12.16% | 15.76% | 12.25% |
| Foreign Equity Strategy | 6.00% | 23.15% | 6.16% | 7.93% | 7.75% |
| MSCI ACWI ex US MinVol | 5.48% | 35.72% | 9.38% | 11.08% | 5.74% |
| Core Bond Strategy | 3.10% | 3.72% | 6.43% | 4.87% | 5.77% |
| Bbg Barc US Aggregate Index | 1.83% | -0.33% | 5.35% | 3.03% | 3.38% |
| Short Term Bond Strategy | 1.98% | 6.34% | 5.64% | 4.82% | 5.14% |
| Bbg Barc US Corp 1-5 Yr TR | 0.70% | 2.17% | 4.63% | 3.11% | 2.88% |
| Municipal Bond Strategy | 2.78% | 8.01% | 5.95% | 4.81% | 6.29% |
| Bbg Barc Muni Bond Index | 1.42% | 4.17% | 5.10% | 3.25% | 4.22% |
1Net of fees assumes a 0.75% management fee applied monthly. The three, five and ITD are shown annualized. These returns are illustrative, hypothetical numbers representative of two actual return streams (Liquid Strategies Overlay and the underlying index ETF). The numbers illustrate what would have happened had we taken the underlying index ETF returns and added Liquid Strategy Overlay returns to them. Source: Morningstar, Liquid Strategies.
HEDGED LARGE CAP EQUITY SINCE INCEPTION RETURNS (Net1)
06/30/2019 - 06/30/2021
| Inception to Date | |
| Annualized Return (Net) | 19.19% |
| Annualized Volatility | 9.16% |
| Sharpe Ratio | 1.89 |
| Max Drawdown | -6.23% |
| Beta vs S&P 500 | 0.45 |
| Up Capture | 64.05% |
| Down Capture | 38.11% |
OVERLAY STRATEGY ANNUALIZED PERFORMANCE
11/01/2013 - 06/30/2021
| Q2 | 1 YEARS | 3 YEARS | 5 YEARS | Inception to Date | |
| Overlay Strategy (Gross) | 1.50% | 5.09% | 1.84% | 2.63% | 3.12% |
| Overlay Strategy (Net) | 1.31% | 4.31% | 1.08% | 1.87% | 2.35% |
Net of fees assumes a 0.75% management fee applied monthly.
*Hypothetical/Illustrative performance is not an indicator of future actual results. The results reflect performance of a strategy not offered to investors during the time indicated in the analysis and do not represent returns that any investor actually attained. Hypothetical/Illustrative results are calculated by the retroactive application of the Overlay strategy constructed on the basis of historical data combined with other existing independently-managed ETFs and based on assumptions integral to this presentation which may or may not be testable and are subject to losses. General assumptions include: The manager would have been able to purchase securities in a single portfolio with similar characteristics to the Overlay Strategy and the Index ETFs recommended by the illustration, and the markets were sufficiently liquid to permit all trading. Indexes used for comparative purposes cannot be traded, however there are securities, funds, and similar investments that can be purchased to obtain similar results and include no fees. Changes in these assumptions may have a material impact on the hypothetical returns presented. No representations and warranties are made as to the reasonableness of the assumptions. This information is provided for illustrative purposes only. Actual performance may differ significantly from hypothetical/illustrative performance. Source: Morningstar, Bloomberg, L.P., Liquid Strategies.
The equity markets continued to be the benefactor of a very supportive Fed and increased optimism that inflation will not become a major issue over the long term. A combination of supportive monetary and fiscal policy, strong earnings and economic growth, and still low interest rates continued to make equities “the only game in town".
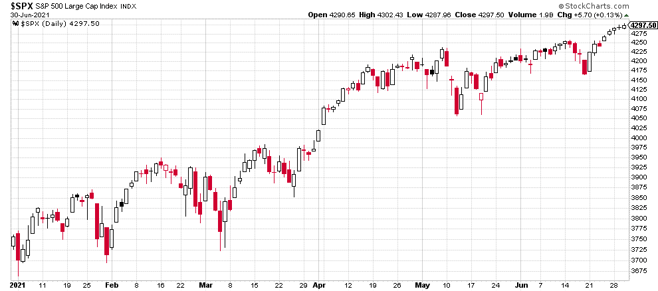
Against this backdrop, the Small Cap Equity Overlay Strategy finished the quarter and trailing year up 5.68% and 74.13%, respectively, vs. the S&P SmallCap 600 Index benchmark up 4.51% and 67.40%. The Large Cap Equity Overlay Strategy finished the quarter and trailing year up 9.76% and 46.62%, respectively, vs. the S&P 500 Index benchmark up 8.55% and 40.78%. The outperformance of these strategies relative to their benchmarks is attributable to the positive returns delivered by the Overlay part of the strategies. The Foreign Equity Overlay Strategy also had positive contribution from the Overlay, helping to outperform its benchmark for the quarter, while the use of MinVol developed and Emerging Market exposure has led to underperformance on a 1 year basis. Finally, the Hedged Large Cap Equity Strategy continued to perform as expected in Q2, up 7.00% for the quarter and 28.09% for the trailing year while providing investors with significant downside protection.
After a tough start to the year, the bond market produced positive returns for the quarter from a combination of a stabilization in interest rates and continued tight credit spreads.
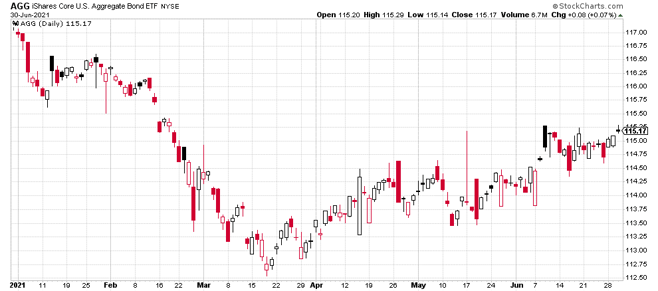
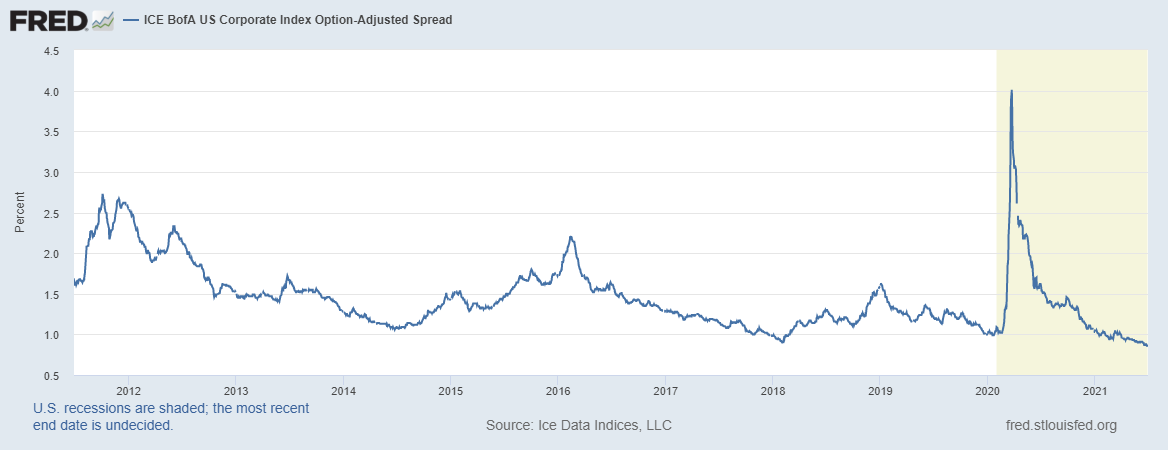
For our bond-based strategies, the Overlay continued to deliver meaningful outperformance. The Core Bond Overlay Strategy finished the quarter and trailing year up 3.10% and 3.72%, respectively, vs. the Bloomberg Barclay’s Aggregate Bond Index up 1.83% and down 0.33%. The Short-Term Bond Overlay Strategy finished the quarter and trailing year up 1.98% and 6.34%, respectively, vs. the Bloomberg Barclay’s US Corporate 1-5 Year Bond Index up 0.71% and 2.17%. The Municipal Bond Overlay Strategy finished the quarter and trailing year up 2.78% and 8.01%, respectively, vs. the Bloomberg Barclay’s Municipal Bond Index up 1.42% and 4.17%.
Regarding the outlook moving forward, the collapse in volatility in most risk assets indicates a market expectation of continued calm and grind higher in equities. Quiet markets like this can last for some period of time, with 2017 being a great example of a low volatility market that benefited most risk assets. However, much like 2017, these quiet periods can end very abruptly, even with a modest catalyst. This risk is even more significant when equities and bonds are trading in such lock step given the hyper-focus on the impact that future interest rate policy has on both markets. The de-risking that could come with a simultaneous sell off in stocks and bonds could take many by surprise as a cascade of risk controls could cause a cycle of forced selling. It is impossible to tell when a significant pullback will take place or how much higher the markets can go before it happens. However, investors should be prepared with a plan for how to approach the inevitable rather than reacting emotionally at the time. We view corrections as a healthy and normal part of functioning markets and necessary to support the alpha generated by our Overlay strategy. Through our variety of solutions, investors can properly position themselves for a wide variety of potential outcomes on interest rates and equity prices.
As always, we would like to extend an open invitation to serve as a resource for anyone that would like to discuss our views on the markets, particularly as it relates to the relationship between volatility and risk assets. We appreciate your continued support and interest.

Shawn Gibson, CIO, Portfolio Manager
Adam Stewart, CFA, Portfolio Manager
Justin Boller, CFA, Portfolio Manager
The assertions and statements in this blog post are based on the opinions of the author and Liquid Strategies. The examples cited in this paper are based on hypothetical situations and should only be considered as examples of potential trading strategies. They do not take into consideration the impact that certain economic or market factors have on the decision making process. Past performance is no indication of future results. Inherent in any investment is the potential for loss.
