
After a historic collapse in the 1st quarter of 2020, the U.S. equity markets staged a dramatic recovery, finishing with the best quarterly return (+20.54% for the S&P 500 Index) since Q4 1998. This strong market recovery coupled with high but falling equity volatility served as significant tailwinds for our strategies, which were able to benefit both from the gains in risk assets as well as gains from our income-based Overlay Strategy. For the quarter, the Overlay Strategy generated gross income of 1.80% bringing the annualized gross income produced by the Strategy to 2.83% since inception in 2013.
| Overlay Strategy Returns through 6/30/20 | |
| Q2 2020 | Annualized Since Inception (11/1/2013) |
| 1.80% (Gross) | 2.83% (Gross) |
| 1.61% (Net) | 2.06% (Net) |
Net of fees assumes a 0.75% management fee applied monthly.
ANNUALIZED SEPARATE ACCOUNT ILLUSTRATIVE RETURNS (Net1)
11/01/2013 - 06/30/2020
| 1 YEARS | 3 YEARS | 5 YEARS | Inception to Date | |
| Large Cap Equity Strategy | 8.14% | 9.66% | 12.22% | 13.04% |
| S&P 500 Index | 7.50% | 10.72% | 10.72% | 11.14% |
| Small Cap Equity Strategy | -10.64% | -0.35% | 5.90% | 7.56% |
| S&P 600 Index | -11.31% | 0.51% | 4.42% | 5.73% |
| Foreign Equity Strategy | -5.47% | 0.72% | 4.58% | 5.61% |
| MSCI ACWI ex US | -4.80% | 1.13% | 2.26% | 1.85% |
| Core Bond Strategy | 10.01% | 4.78% | 6.11% | 6.08% |
| Bbg Barc US Agg Index | 8.74% | 5.32% | 4.30% | 3.95% |
| Municipal Bond Strategy | 9.80% | 4.96% | 5.46% | 6.25% |
| Bbg Barc Muni Bond Index | 7.54% | 4.72% | 3.53% | 4.23% |
1Net of fees assumes a 0.75% management fee applied monthly. These returns are illustrative, hypothetical numbers representative of two actual return streams (Liquid Strategies Overlay and the underlying index ETF). The numbers illustrate what would have happened had we taken the underlying index ETF returns and added Liquid Strategy Overlay returns to them. Source: Morningstar, Liquid Strategies.
OVERLAY STRATEGY ANNUALIZED PERFORMANCE
11/01/2013-06/30/2020
| 1 YEAR | 3 YEARS | 5 YEARS | Inception to Date | |
| Overlay Strategy (Gross) | 1.75% | 0.26% | 2.51% | 2.83% |
| Overlay Strategy (Net) | 0.99% | -0.49% | 1.74% | 2.06% |
Net of fees assumes a 0.75% management fee applied monthly.
*Hypothetical/Illustrative performance is not an indicator of future actual results. The results reflect performance of a strategy not offered to investors during the time indicated in the analysis and do not represent returns that any investor actually attained. Hypothetical/Illustrative results are calculated by the retroactive application of the Overlay strategy constructed on the basis of historical data combined with other existing independently-managed ETFs and based on assumptions integral to this presentation which may or may not be testable and are subject to losses. General assumptions include: The manager would have been able to purchase securities in a single portfolio with similar characteristics to the Overlay Strategy and the Index ETFs recommended by the illustration, and the markets were sufficiently liquid to permit all trading. Indexes used for comparative purposes cannot be traded, however there are securities, funds, and similar investments that can be purchased to obtain similar results and include no fees. Changes in these assumptions may have a material impact on the hypothetical returns presented. No representations and warranties are made as to the reasonableness of the assumptions. This information is provided for illustrative purposes only. Actual performance may differ significantly from hypothetical/illustrative performance. Source: Morningstar, Bloomberg, L.P., Liquid Strategies.
S&P 500 Index 6/30/15 – 6/30/2020
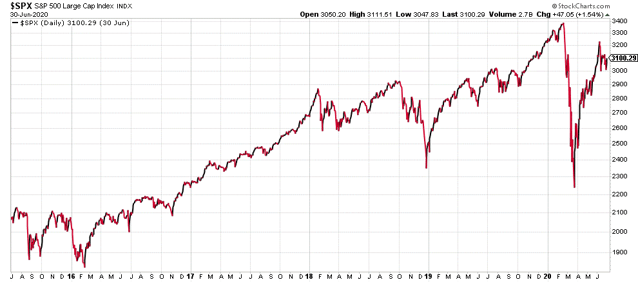 Source: StockCharts.com
As previously mentioned, the S&P 500 Index produced the strongest quarterly return in over 20 years. This rally has left many investors confused and frustrated that the equity markets seem to be disconnected from the current economic reality. It is important to remember that equity investors base valuation decisions on a discount of anticipated future cash flows, meaning they are looking out multiple years and factoring in what they believe to be the long-term trajectory and sustainability of the COVID-19 recovery. Based on the level and pace of recovery so far, investors are clearly counting on not only a full economic recovery sooner than Main Street expects, but are perhaps also pricing in the possibility that the massive fiscal stimulus programs and quantitative easing combined with low interest rates could spur the economy to levels beyond where it was pre-COVID 19. In addition to more optimism around the long-term economic recovery, it is important to also recognize that investor psychology is playing a role in the rally. Many investors reduced equity exposure near the March lows out of fear of a full-blown economic depression. There is a pain point for such investors where they cannot tolerate watching the market recover while they are on the sidelines, resulting in “FOMO,” or fear of missing out. We believe that FOMO has been a meaningful contributor to the rally over the past several weeks and could play a key role moving forward.
This is not to say that equity markets are not without significant risk. The next two quarters of earnings and economic data will be critical for the markets. Should this data start to deteriorate in a meaningful way, investors may be forced to adjust forward-looking assumptions to account for the risk of a slower and longer recovery process. The equity volatility markets are often a good place to gain insight as to the market perception of future market risk. The CBOE Volatility Index (the “VIX”) measures the expectations of equity volatility over the next 30 days. After a massive spike in Q1, the index has since come down significantly but is still well above the long-term average of 19-20. This indicates that investors are still on edge that there could be a short-term catalyst for a market decline, and that the market could be vulnerable to such a catalyst given the size of the rally.
CBOE Volatility Index 6/30/15 – 6/30/2020
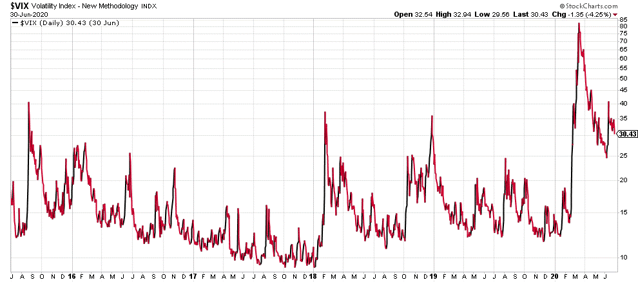 Source: StockCharts.com
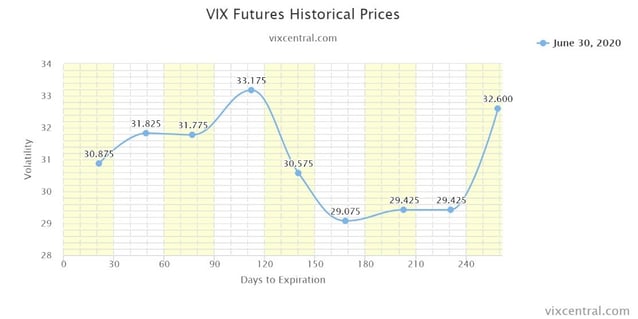
VIX futures are a great tool for looking at longer-term volatility expectations as they show where participants think the VIX will settle at various points in the future. At the end of the quarter, the market was still pricing in future volatility that is well above historic norms. Of note, there is a “kink” in the curve around the election where it goes up around that time and drops off significantly afterwards. This kink is pricing in additional risk of a major election surprise.
It is impossible for anyone to predict where the market will be at any point in the future, and thankfully we are not dependent on certain outcomes for our strategy to be successful. With that said, a case could be made both for a break out to new highs as well a long and painful bear market bottoming process. As such, we encourage advisors and investors to take a prudent/balanced approach and reexamine pockets of risk in portfolios that could be replaced with unique, value-added solutions. This recovery could provide a great opportunity for improving the risk-adjusted return potential for portfolios. We would like to extend an open invitation to serve as a resource for anyone that would like to discuss our views on the markets, particularly as it relates to the relationship between volatility and risk assets. As always, we appreciate your continued support and interest.

Shawn Gibson, CIO, Portfolio Manager
Brad Ball, CEO, Portfolio Manager
Adam Stewart, CFA, Portfolio Manager
Justin Boller, CFA, Portfolio Manager
If you missed our Q2 webinar, access the replay at the below link.
Q2 Manager Commentary and Volatility Outlook Webinar
Learn more about Liquid Strategies and our offerings.
The assertions and statements in this blog post are based on the opinions of the author and Liquid Strategies. The examples cited in this paper are based on hypothetical situations and should only be considered as examples of potential trading strategies. They do not take into consideration the impact that certain economic or market factors have on the decision making process. Past performance is no indication of future results. Inherent in any investment is the potential for loss.
