
The 1st quarter of 2022 can best be described as a quarter of "risk recalibration" where all risk assets had to adjust to a far more uncertain and risky outlook. Equities and bonds both lost value, leading many to declare the death of 60/40 as the utility of bonds as a risk reducer came into question. This recalibration of risk also took place in the options market, leading to a temporary period of negative volatility risk premium early in the quarter, providing a headwind to the Overlay Strategy. This risk premium, however, turned positive in time for us to once again produce positive incremental return in the 2nd part of the quarter, reducing the gross underperformance for the Strategy -0.78% YTD. These short-term losses are expected occasionally and are an important part of the process of keeping this opportunity available. This alpha source continues to provide a source of outperformance and compelling long-term performance for the Overlay strategies.
ANNUALIZED SEPARATE ACCOUNT ILLUSTRATIVE RETURNS (Net1)
11/01/2013 - 03/31/2022
| Q1 | 1 YEARS | 3 YEARS | 5 YEARS | Inception to Date | |
| Large Cap Equity Strategy | -5.59% | 16.42% | 20.33% | 16.48% | 16.13% |
| S&P 500 Index | -4.60% | 15.63% | 18.91% | 15.98% | 14.09% |
| Small Cap Equity Strategy | -6.65% | 1.76% | 14.86% | 11.33% | 12.65% |
| S&P 600 Index | -5.62% | 1.23% | 13.58% | 10.89% | 10.72% |
| Foreign Equity Strategy | -6.35% | 1.76% | 4.41% | 5.45% | 6.51% |
| MSCI ACWI ex US MinVol | -5.44% | -1.48% | 7.51% | 6.76% | 4.37% |
| Core Bond Strategy | -6.77% | -3.33% | 3.09% | 2.88% | 4.44% |
| Bbg Barc US Aggregate Index | -5.93% | -4.15% | 1.69% | 2.14% | 2.34% |
| Short Term Bond Strategy | -4.61% | -2.69% | 3.09% | 2.74% | 4.09% |
| Bbg Barc US Corp 1-5 Yr TR | -3.73% | -3.61% | 1.74% | 2.08% | 2.09% |
| Municipal Bond Strategy | -6.36% | -2.88% | 3.15% | 3.15% | 5.01% |
| Bbg Barc Muni Bond Index | -6.23% | -4.47% | 1.53% | 2.52% | 3.10% |
1Net of fees assumes a 0.75% management fee applied monthly. The three, five and ITD are shown annualized. These returns are illustrative, hypothetical numbers representative of two actual return streams (Liquid Strategies Overlay and the underlying index ETF). The numbers illustrate what would have happened had we taken the underlying index ETF returns and added Liquid Strategy Overlay returns to them. Source: Morningstar, Liquid Strategies.
HEDGED LARGE CAP EQUITY SINCE INCEPTION RETURNS (Net1)
06/30/2019 - 03/31/2022
| Inception to Date | |
| Annualized Return (Net) | 14.78% |
| Annualized Volatility | 9.55% |
| Sharpe Ratio | 1.35 |
| Max Drawdown | -7.51% |
| Beta vs S&P 500 | 0.53 |
| Up Capture | 66.44% |
| Down Capture | 42.42% |
OVERLAY STRATEGY ANNUALIZED PERFORMANCE
11/01/2013 - 03/31/2022
| Q1 | 1 YEARS | 3 YEARS | 5 YEARS | Inception to Date | |
| Overlay Strategy (Gross) | -0.78% | 1.79% | 2.27% | 1.53% | 2.88% |
| Overlay Strategy (Net) | -0.96% | 1.03% | 1.50% | 0.77% | 2.11% |
Net of fees assumes a 0.75% management fee applied monthly.
*Hypothetical/Illustrative performance is not an indicator of future actual results. The results reflect performance of a strategy not offered to investors during the time indicated in the analysis and do not represent returns that any investor actually attained. Hypothetical/Illustrative results are calculated by the retroactive application of the Overlay strategy constructed on the basis of historical data combined with other existing independently-managed ETFs and based on assumptions integral to this presentation which may or may not be testable and are subject to losses. General assumptions include: The manager would have been able to purchase securities in a single portfolio with similar characteristics to the Overlay Strategy and the Index ETFs recommended by the illustration, and the markets were sufficiently liquid to permit all trading. Indexes used for comparative purposes cannot be traded, however there are securities, funds, and similar investments that can be purchased to obtain similar results and include no fees. Changes in these assumptions may have a material impact on the hypothetical returns presented. No representations and warranties are made as to the reasonableness of the assumptions. This information is provided for illustrative purposes only. Actual performance may differ significantly from hypothetical/illustrative performance. Source: Morningstar, Bloomberg, L.P., Liquid Strategies.
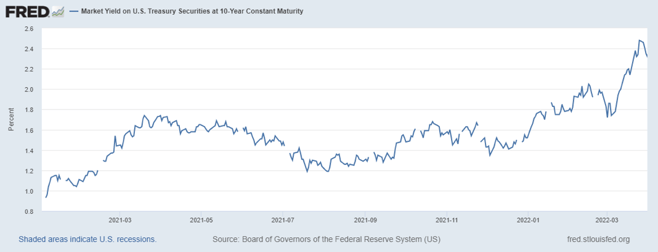
We noted in our year end 2021 letter that "it appears the “easy” money in equities has been made and investors will likely be more discriminating given the risk of a spike in interest rates” and “a sharp move higher in rates would challenge equity valuations, particularly in the high multiple sectors with high leverage.” A combination of high Inflation numbers and a steadily more hawkish Fed led to an upward snap in interest rates, despite the geopolitical uncertainty created by the Russian invasion of Ukraine (bonds usually catch a bid in such times). The jump in 10-year yields helped to boost mortgage rates at a time where home affordability is already a major problem given the jump In home prices.
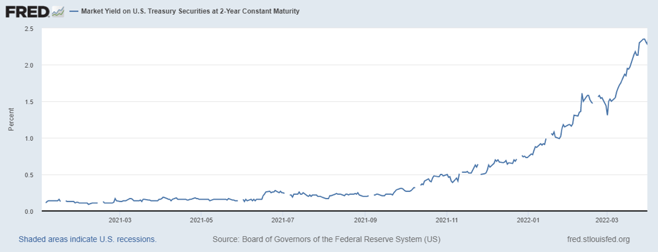
During the same period, the 2-year yields had an even more pronounced spike as those bonds more directly anticipated Fed Interest rate hikes into their pricing.
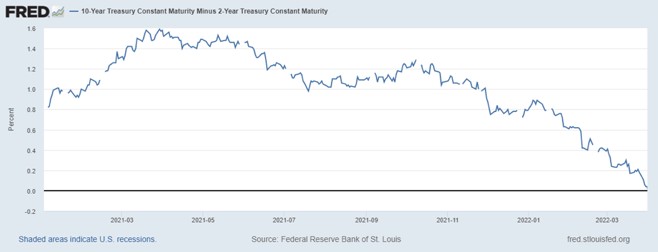
The quicker rise in 2-year yields relative to 10-year yields led to a rapid flattening of the yield curve. Yield curve inversions are thought to "predict" when a recession is coming, so the media has been fixated on this relationship. While yield curve inversions don't always result in recessions, they do send a message that the possible range of economic outcomes has widened.
The spike in yields led to losses in most bonds, regardless of duration or credit quality. These losses would have been worse if it weren't for the fact that interest rate spreads remained historically tight. A simultaneous rise in rates and credit spreads is a risk to be aware of later in the year. For now, stable spreads are signaling a low probability of a recession. The Core Bond Overlay Strategy finished the quarter down 6.77% vs. the Bloomberg Barclay’s Aggregate Bond Index down 5.93%. The Short-Term Bond Overlay Strategy finished the quarter down 4.61% vs. the Bloomberg Barclay’s US Corporate 1-5 Year Bond Index down 3.73%. The Municipal Bond Overlay Strategy finished the quarter down 6.36% vs. the Bloomberg Barclay’s Municipal Bond Index down 6.23%.
In the equity markets, as expected, the rapid shift in interest rates did have an outsized impact on companies, sectors and geographies with higher valuations, larger debt and more instability. U.S. Large Cap stocks were one of the best homes in a bad neighborhood. The Large Cap Equity Overlay Strategy finished the quarter down 5.59% vs. the S&P 500 Index benchmark down 4.60%. The Small Cap Equity Overlay Strategy finished the quarter down 6.65% vs. the S&P SmallCap 600 Index benchmark down 5.62%. The Foreign Equity Overlay Strategy was down 6.35% vs. the ACWI ex-US benchmark down 5.44%.
Looking forward, the macro environment could be setting up an attractive opportunity set for our alpha source (the Overlay) for several reasons:
- The possible range of outcomes with equities and interest rates over the next 12-18 months has widened significantly. This should keep market volatility elevated, which increases the premiums available.
- After a brief period where options were underpriced, they have since been recalibrated to be overpriced again, as they have been more than 90% of the time over the past three decades.
- Investors are using their imaginations on how bad things could get, leading them to aggressively buy market protection, further increasing the premiums that we can collect.
While the opportunity set should be attractive, we will still focus on risk management as the top priority. Should the volatility experienced in the 1st quarter continue for the remainder of the year, 2022 will turn out to be one of the most volatile years since the Great Financial Crisis. Against this backdrop, we understand that many advisors don't want to be in bonds (interest rate risk) or stocks (valuation/recession risk) but feel they have nowhere to go. We have solutions that can help you deal with this dilemma and would welcome the opportunity to discuss how other advisors are working with us to solve this problem.
We appreciate your continued support and interest.

Shawn Gibson, Founding Member
Adam Stewart, CFA, Portfolio Manager
Justin Boller, CFA, Portfolio Manager
The assertions and statements in this blog post are based on the opinions of the author and Liquid Strategies. The examples cited in this paper are based on hypothetical situations and should only be considered as examples of potential trading strategies. They do not take into consideration the impact that certain economic or market factors have on the decision making process. Past performance is no indication of future results. Inherent in any investment is the potential for loss.
