
The “Recovery Trade” remained in full effect in the first quarter, driving equity markets and interest rates sharply higher. The Overlay component of our strategies added approximately 1.02% in gross incremental return, further improving the gains in the equity-based strategies while offsetting a portion of rate-related bond declines in the fixed income based strategies. Overall, it was a solid quarter for the Overlay strategies, and a continuation of compelling long-term performance.
ANNUALIZED SEPARATE ACCOUNT ILLUSTRATIVE RETURNS (Net1)
11/01/2013 - 03/31/2021
| Q1 | 1 YEARS | 3 YEARS | 5 YEARS | Inception to Date | |
| Large Cap Equity Strategy | 7.20% | 63.14% | 17.18% | 18.35% | 16.09% |
| S&P 500 Index | 6.17% | 56.33% | 16.77% | 16.29% | 13.89% |
| Small Cap Equity Strategy | 19.33% | 104.29% | 14.05% | 17.63% | 14.21% |
| S&P 600 Index | 18.23% | 95.26% | 13.67% | 15.53% | 12.02% |
| Foreign Equity Strategy | 1.04% | 28.43% | 3.35% | 7.51% | 7.17% |
| MSCI ACWI ex US MinVol | 0.57% | 22.31% | 3.83% | 5.98% | 5.43% |
| Core Bond Strategy | -2.56% | 5.36% | 5.39% | 5.19% | 5.54% |
| Bbg Barc US Agg Index | -3.37% | 0.71% | 4.66% | 3.10% | 3.24% |
| Short Term Bond Strategy | 0.20% | 11.45% | 5.14% | 5.23% | 5.04% |
| Bbg Barc US Corp 1-5 Yr TR | -0.59% | 7.13% | 4.49% | 3.25% | 2.88% |
| Municipal Bond Strategy | 0.16% | 9.65% | 5.33% | 5.26% | 6.12% |
| Bbg Barc Muni Bond Index | -0.35% | 5.51% | 4.91% | 3.49% | 4.17% |
1Net of fees assumes a 0.75% management fee applied monthly. The three, five and ITD are shown annualized. These returns are illustrative, hypothetical numbers representative of two actual return streams (Liquid Strategies Overlay and the underlying index ETF). The numbers illustrate what would have happened had we taken the underlying index ETF returns and added Liquid Strategy Overlay returns to them. Source: Morningstar, Liquid Strategies.
HEDGED LARGE CAP EQUITY SINCE INCEPTION RETURNS (Net1)
06/30/2019 - 03/31/2021
| Inception to Date | |
| Annualized Return (Net) | 17.58% |
| Annualized Volatility | 9.47% |
| Sharpe Ratio | 1.67 |
| Max Drawdown | -6.23% |
| Beta vs S&P 500 | 0.44 |
| Up Capture | 61.71% |
| Down Capture | 38.11% |
OVERLAY STRATEGY ANNUALIZED PERFORMANCE
11/01/2013 - 03/31/2021
| Q1 | 1 YEARS | 3 YEARS | 5 YEARS | Inception to Date | |
| Overlay Strategy (Gross) | 1.02% | 5.40% | 1.50% | 2.85% | 3.02% |
| Overlay Strategy (Net) | 0.83% | 4.62% | 0.74% | 2.09% | 2.25% |
Net of fees assumes a 0.75% management fee applied monthly.
*Hypothetical/Illustrative performance is not an indicator of future actual results. The results reflect performance of a strategy not offered to investors during the time indicated in the analysis and do not represent returns that any investor actually attained. Hypothetical/Illustrative results are calculated by the retroactive application of the Overlay strategy constructed on the basis of historical data combined with other existing independently-managed ETFs and based on assumptions integral to this presentation which may or may not be testable and are subject to losses. General assumptions include: The manager would have been able to purchase securities in a single portfolio with similar characteristics to the Overlay Strategy and the Index ETFs recommended by the illustration, and the markets were sufficiently liquid to permit all trading. Indexes used for comparative purposes cannot be traded, however there are securities, funds, and similar investments that can be purchased to obtain similar results and include no fees. Changes in these assumptions may have a material impact on the hypothetical returns presented. No representations and warranties are made as to the reasonableness of the assumptions. This information is provided for illustrative purposes only. Actual performance may differ significantly from hypothetical/illustrative performance. Source: Morningstar, Bloomberg, L.P., Liquid Strategies.
The equity markets continued to be the benefactor of extreme fiscal and monetary stimulus fueling the animal spirits in the market. Investors are looking well past the late innings of the COVID recovery towards a potential sharp acceleration of economic growth late this year and into 2022. Such growth would be a boon for corporate earnings, jobs growth, and consumer confidence but can also result in an overshoot in inflation (discussed later). This optimism resulted in sharply higher U.S. equity markets for the 1st quarter and the past year. The Small Cap Equity Overlay Strategy finished the quarter and trailing one year up 19.33% and 104.29%, respectively, vs. the S&P SmallCap 600 Index benchmark up 18.23% and 95.26%. The Large Cap Equity Overlay Strategy finished the quarter and trailing one year up 7.20% and 63.14%, respectively, vs. the S&P 500 Index benchmark up 6.17% and 56.33%. The outperformance of these strategies relative to their benchmarks is attributable to the positive returns delivered by the Overlay part of the strategies. The Foreign Equity Overlay Strategy also had positive contribution from the Overlay but the use of MinVol EFA and EEM exposure created underperformance relative to the benchmark both YTD and for the past twelve months. The Hedged Large Cap Equity Strategy performed as expected in Q1, benefiting from a rise in equity markets but also hindered by the markdown of the portfolio hedges relating to a rising market and rapidly contracting volatility. These markdowns are temporary, as the hedges were marked up once April trading provided a drop in equities and a sharp increase in volatility. We expect the Strategy to continue to deliver equity-like returns to investors while giving them peace of mind that a protective floor always exists in the portfolio.
Unlike equities, bond prices did not benefit from increased economic optimism, as sharply higher interest rates drove bond prices lower, particularly in core bond holdings. While the benchmark for all three bond strategies were negative for the quarter, both the Municipal Bond Overlay and the Short-Term Bond Overlay strategies delivered positive returns due to the positive contribution from the Overlay. The Overlay also helped to offset a portion of the losses in the AGG holdings of the Core Bond Overlay. This quarter highlights the potential value of the Overlay, which is not only to provide an opportunity for higher yield, but also to provide more of a buffer from interest rate risk.
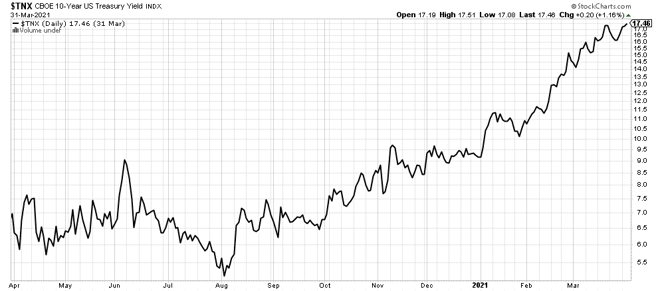
Returning to the subject of inflation, this is arguably the biggest risk in the market over the next 12 months, but is also a potential driver of continued economic growth and equity appreciation. The interest rate markets are quickly recalibrating expectations for future growth and reflation, driving the 10-year Treasury yield up 90% from 0.92% to nearly 1.75% in the 1st Quarter alone! The yield has more than tripled since early August 2020. It is important to remember that rising interest rates can actually be a good thing, as they typically indicate improving economic conditions. The potential negative by-product of that growth is inflation, and while some inflation is actually a good thing, sustained inflation that is well above the FOMC’s mandate could result in an abrupt reversal of monetary policy. It seems as if (at least at this point), the FOMC is willing to let jobs growth and inflation run hot to further fuel the post-COVID recovery, and may dismiss some signs of inflation as just temporary. A Goldilocks scenario where inflation stops near the Fed’s desired level while jobs growth continues to expand would be the ideal outcome for equity investors. The risk is that investors get spooked by any early signs of inflation rather than waiting to see if it is temporary, which could lead to simultaneous pressure on equities and bonds.
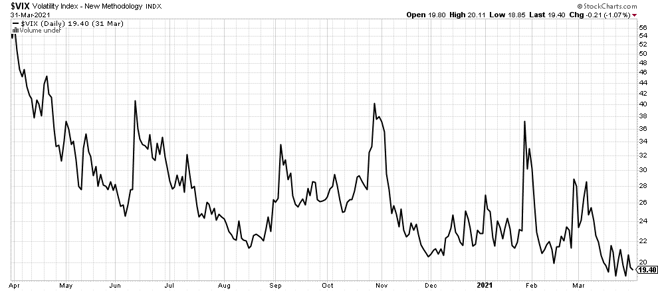
At least for now, inflation risk (or really any risk for that matter) appears to be on the back burner for equity investors. This is evidenced by a sharp contraction in overall equity market volatility as well as expectations of future volatility as measured by the CBOE S&P 500 Volatility Index. It appears that we may be heading into the early innings of a new low volatility regime where the VIX spends more time below 20 than above 20 after a wild year in a high volatility regime. This is supported by the fact that high volatility regimes tend to coincide with recessions while low volatility regimes tend to coincide with growth and easy monetary policy.
While equity markets seem to be in “grind higher” mode, it is likely that at some point the markets will overact to a piece of bad news to correct some of the gains. It would not take much to motivate investors to take some profits in that sort of a situation, but the strong buy the dip mentality witnessed over the past year will likely limit the potential drawdown. A dramatic shift in inflation expectations and any signs of hawkish rhetoric from the FOMC could spark a greater bout of volatility. However, investors continue to treat equities like the only place to be. Our Overlay strategy has benefitted from and may continue to benefit from a stable equity environment, while having the risk controls in place to respond to a market shift.
As always, we would like to extend an open invitation to serve as a resource for anyone that would like to discuss our views on the markets, particularly as it relates to the relationship between volatility and risk assets. We appreciate your continued support and interest.

Shawn Gibson, CIO, Portfolio Manager
Brad Ball, CEO
Adam Stewart, CFA, Portfolio Manager
Justin Boller, CFA, Portfolio Manager
The assertions and statements in this blog post are based on the opinions of the author and Liquid Strategies. The examples cited in this paper are based on hypothetical situations and should only be considered as examples of potential trading strategies. They do not take into consideration the impact that certain economic or market factors have on the decision making process. Past performance is no indication of future results. Inherent in any investment is the potential for loss.
