
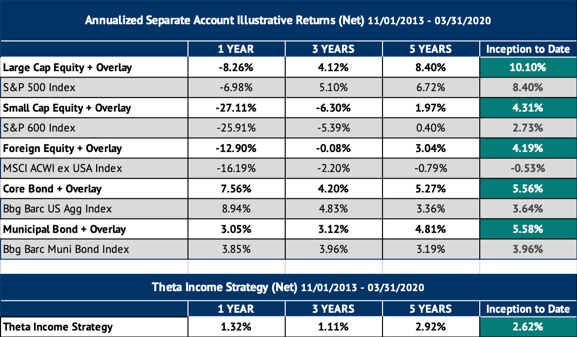
While there is much to discuss from a markets perspective, first and foremost we hope you and all of your loved ones are safe and healthy. In previous letters, we laid out a number of potential catalysts for ending the historic bull market and starting a global recession, including the possibility for events that at the time no one could anticipate. COVID-19 turned out to be that great unknown, sending shockwaves throughout the financial system as investors attempted to find the “right” discount to apply to risk assets given the high level of uncertainty for the economy, earnings and even solvency for many companies and industries. The end result was one of the most violent equity market declines in U.S. history, with the S&P 500 Index losing over 35% in just the course of a few weeks, bringing with it historic levels of market volatility. Despite such extreme market conditions, the Overlay Strategy (utilized as an income generation tool within our six main strategies), actually generated a positive 0.37% return for March with the S&P 500 Index -12.35%, and -1.99% YTD compared to -19.60% for the S&P 500 Index. The Strategy continues to demonstrate the ability to generate positive long-term incremental income to underlying beta sources while protecting capital during times of market stress. For investors that would have been invested in these various strategies since the inception of the firm, below are the illustrative long-term performance results:
 *Hypothetical/Illustrative performance is not an indicator of future actual results. The results reflect performance of a strategy not offered to investors during the time indicated in the analysis and do not represent returns that any investor actually attained. Hypothetical/Illustrative results are calculated by the retroactive application of the Overlay strategy constructed on the basis of historical data combined with other existing independently-managed ETFs and based on assumptions integral to this presentation which may or may not be testable and are subject to losses. General assumptions include: The manager would have been able to purchase securities in a single portfolio with similar characteristics to the Overlay Strategy and the Index ETFs recommended by the illustration, and the markets were sufficiently liquid to permit all trading. Indexes used for comparative purposes cannot be traded, however there are securities, funds, and similar investments that can be purchased to obtain similar results and include no fees. Changes in these assumptions may have a material impact on the hypothetical returns presented. No representations and warranties are made as to the reasonableness of the assumptions. This information is provided for illustrative purposes only. Actual performance may differ significantly from hypothetical/illustrative performance. Source: Morningstar, Bloomberg, L.P., Liquid Strategies.
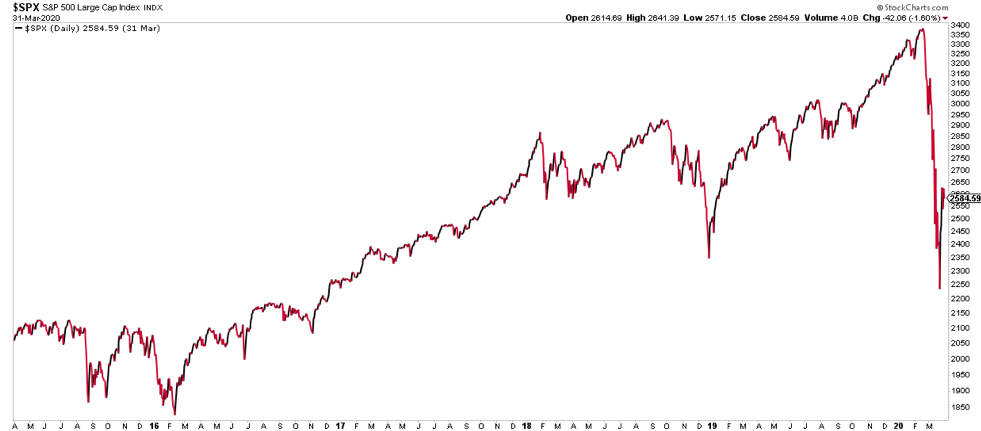
S&P 500 Index 3/31/15 – 3/31/2020
 Source: StockCharts.com
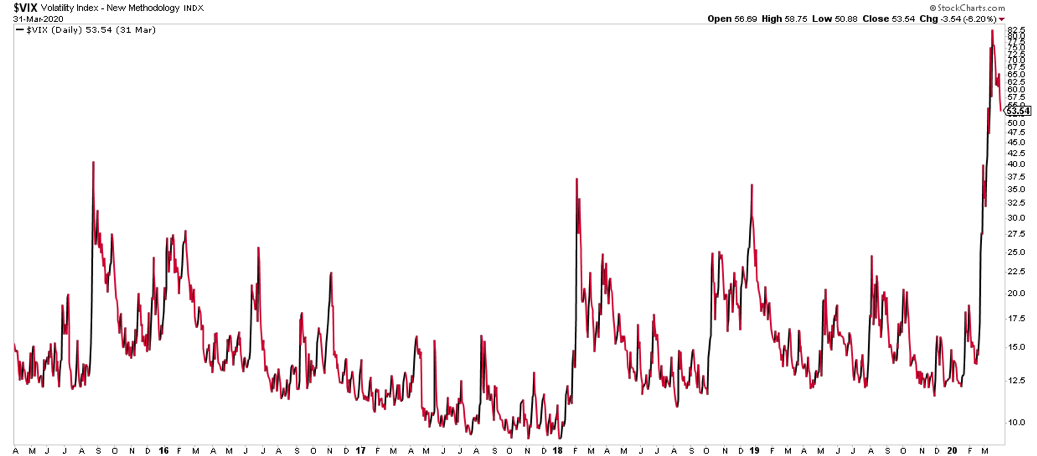
CBOE Volatility Index 3/31/15 – 3/31/2020
 Source: StockCharts.com
As the charts above show, the COVID-19 market collapse was historic (the steepest equity decline since 1987) and came with the new closing highs in volatility, as measured by the CBOE Volatility Index (the “VIX”).
While the Overlay has a very high probability of success over the long-term (roughly 80%), it is a strong commitment to risk management that differentiates the Liquid Strategies’ approach from others. While there are multiple layers of risk management utilized in the investment process, the three key factors that added significant value during this extreme environment were:
1) Lack of leverage (the short put position will not exceed the value of the underlying assets)
2) All positions have clearly defined risk through the use of offsetting long put positions that limit the potential risk of the short put positions
3) The proprietary risk model used to identify market environments with a high level of risk, leading the team to reduce Overlay positions/exposure
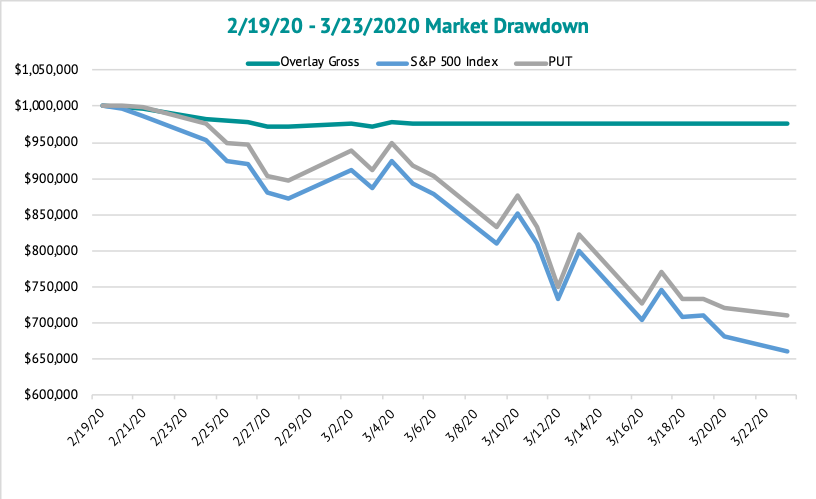
The following chart illustrates the stability of the Overlay on a daily basis relative to the movement of the S&P 500 Index and CBOE S&P 500 Put Write Index (“PUT”):
 Source: Yahoo Finance, CBOE.com, Liquid Strategies, LLC
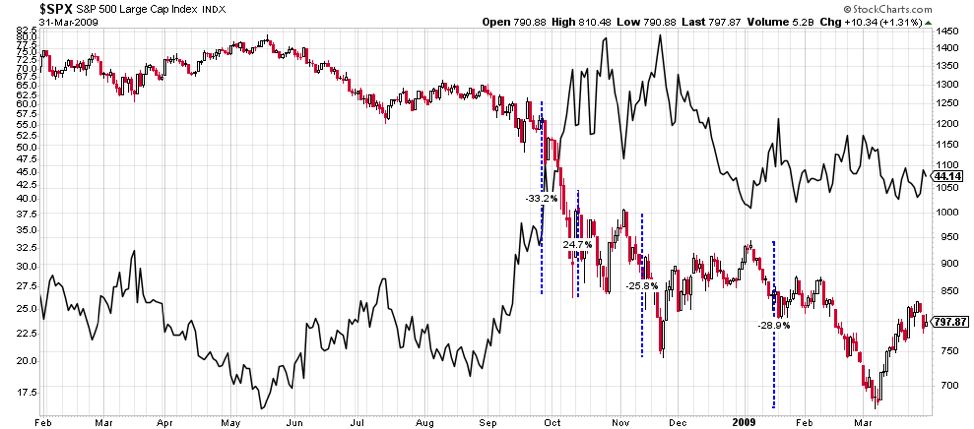
Based on equity market behavior during previous bear markets, it is reasonable to assume that a) the March 23rd low will likely be retested, and b) the overall bottoming process may take months rather than weeks during which investors are often sent on an emotional roller coaster caused by sharp moves higher and lower. Using the Great Financial Crisis of 2008-2009 as a possible blueprint, as the chart below shows, the first major waterfall move lower in the S&P 500 Index was about 33% over just a few weeks. This decline was followed by a sharp move higher of almost 25% from that low in just a couple of days before moving back down to retest and eventually break through that initial low. The full bottoming process took almost 5 months before bottoming in early March 2009. One interesting point is that the VIX actually peaked well before the market bottom. A stabilization of the VIX at lower levels might be a useful guidepost to consider as an indication of increased market stability and a sign that the bottoming process may be closer to the end rather than the beginning.
 Source: StockCharts.com
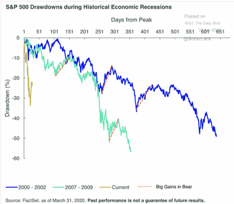
The path of the COVID-19 equity declines have been eerily similar to those of the Financial Crisis. The following charts illustrate how a) the two periods are tracking each other thus far, and b) recessions can have a lengthy impact on the equity markets:
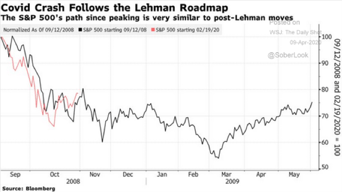
Source: Wall Street Journal "The Daily Shot"
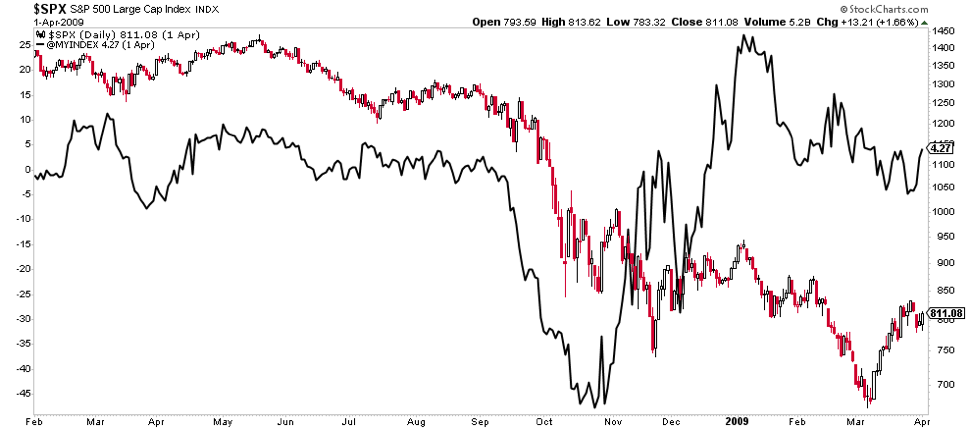
A key factor in the success of the Overlay Strategy is the Volatility Risk Premium, which indicates whether options are underpriced or overpriced. Since the Strategy sells options, it benefits from overpriced options (a positive Volatility Risk Premium). In 2008, the Volatility Risk Premium turned positive months before the markets bottomed, allowing option writers the opportunity to make positive returns even as the market continued to move lower. As we look forward over the coming months, the Strategy will attempt to exploit this positive risk premium, regardless of the overall market direction.
 Source: StockCharts.com
On a longer-term basis, we are very excited about the opportunity set for the Overlay Strategy. Equity volatility moves in very clear long-term cycles, shifting between low-volatility regimes and high-volatility regimes. The Overlay has the ability to produce positive returns in a variety of markets, but the most challenging one is the initial shift between a low-volatility and high-volatility regime which we likely just went through. Fortunately, the Overlay held up quite well during this transition. Looking ahead, one of the best environments for the Overlay Strategy is the multi-year shift from a high volatility regime into a low-volatility regime. A combination of high but falling equity volatility and a stable equity market could pave the way for an ideal environment for the Overlay Strategy for years to come, similar to the multi-year transition out of the Financial Crisis.
VIX 50-Day Moving Average 02/01/08 – 03/31/2019
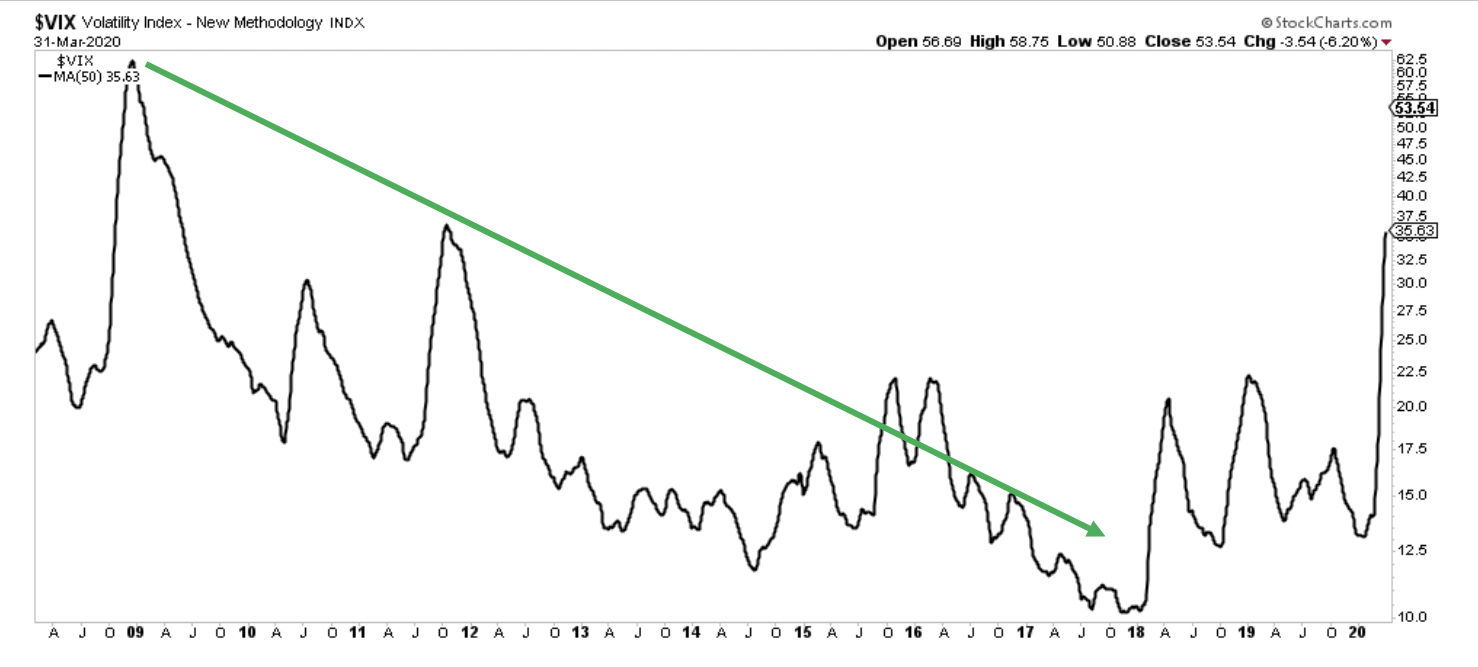 Source: StockCharts.com
We would like to extend an open invitation to serve as a resource for anyone that would like to discuss our views on the markets, particularly as it relates to the relationship between volatility and risk assets. The options markets can be quite informative as to investors’ perception of future risk, and we would be happy to help provide insight as we have navigated through many of these extreme environments over the past decades. As always, we appreciate your continued support and interest.

Shawn Gibson, CIO, Portfolio Manager
Brad Ball, CEO, Portfolio Manager
Adam Stewart, CFA, Portfolio Manager
Justin Boller, CFA, Portfolio Manager
To register for our live webinar on April 16 at 11amET, please use the below link.
Q1 Manager Commentary and Volatility Outlook Webinar
Learn more about Liquid Strategies and our offerings.
The assertions and statements in this blog post are based on the opinions of the author and Liquid Strategies. The examples cited in this paper are based on hypothetical situations and should only be considered as examples of potential trading strategies. They do not take into consideration the impact that certain economic or market factors have on the decision making process. Past performance is no indication of future results. Inherent in any investment is the potential for loss.
