
The final quarter of 2019 was one of the significant milestones and achievements for Liquid Strategies, marking the 6th full year of managing a conservative, risk-controlled option writing overlay program designed to add excess return to fully invested portfolios with a modest increase in overall portfolio volatility. In addition to applying the overlay program on top of existing client assets on a customized basis, the application of the Overlay expanded to provide separate account and packaged solutions (funds and ETFs) to allow the overlay to sit on top of six core underlying sources of beta: 1) Large Cap U.S. Equity; 2) Small Cap U.S. Equity; 3) Non-U.S. Equity 4) Core Bonds; 5) Municipal Bonds; and 6) Short-Duration Bonds. For investors that would have been invested in these various strategies since the inception of the firm, below are the illustrative long-term performance results:
ANNUALIZED SEPARATE ACCOUNT ILLUSTRATIVE RETURNS (Net1)
11/01/2013 - 12/31/2019
| 1 YEARS | 3 YEARS | 5 YEARS | Inception to Date | |
| Large Cap Equity + Overlay | 34.35% | 15.62% | 13.90% | 14.93% |
| S&P 500 Index | 31.49% | 15.27% | 11.70% | 12.68% |
| Small Cap Equity + Overlay | 25.55% | 8.72% | 11.69% | 11.86% |
| S&P 600 Index | 22.78% | 8.36% | 9.56% | 9.70% |
| Foreign Equity + Overlay | 17.70% | 10.74% | 8.82% | 8.05% |
| MSCI ACWI ex US | 21.51% | 9.87% | 5.51% | 3.95% |
| Core Bond + Overlay | 11.25% | 4.74% | 5.36% | 5.64% |
| Bbg Barc US Agg Index | 8.72% | 4.03% | 3.05% | 3.27% |
| Municipal Bond + Overlay | 9.80% | 4.96% | 5.46% | 6.25% |
| Bbg Barc Muni Bond Index | 7.54% | 4.72% | 3.53% | 4.23% |
1Net of fees assumes a 0.75% management fee applied monthly. These returns are illustrative, hypothetical numbers representative of two actual return streams (Liquid Strategies Overlay and the underlying index ETF). The numbers illustrate what would have happened had we taken the underlying index ETF returns and added Liquid Strategy Overlay returns to them. Source: Morningstar, Liquid Strategies.
OVERLAY + SHORT DURATION FIXED INCOME ANNUALIZED PERFORMANCE (Net2)
11/01/2013-12/31/20191
| 1 YEAR | 3 YEARS | 5 YEARS | Inception to Date | |
| Theta Income Strategy | 6.90% | 2.50% | 3.36% | 3.13% |
2Net of fees assumes a 1.00% management fee.
The value proposition of our solutions is the ability to add long-term excess returns above passive benchmarks through the risk-controlled Overlay. While the overlay may create periods of short-term underperformance, the long-term results of the Strategy are clear. In addition to the compounded excess return illustrated in the above table, a key benefit of the Overlay program is a high level of consistency in generating alpha:
- Over 70% of all monthly returns have been positive
- 75% of all quarterly returns have been positive
- 5 of the 6 years have been positive
- 80% of the rolling 1-year returns have been positive
- 100% of the rolling 3-year returns have been positive
The possibility of success of the Overlay is supported by the Volatility Risk Premium (“VRP”) embedded in options. The VRP effectively represents the overpricing of options due to 1) the market routinely overestimating future volatility, and 2) option sellers demanding a premium for taking the risk from option buyers. Looking back over the past 30 years, this VRP has been positive in all but 1 year.
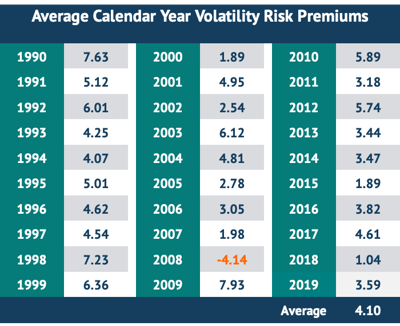 Returns and statistical information presented are for the period 01/01/1990 through 12/31/2019. Past performance may not be indicative of future results. Average Risk Premium Table is calculated using 1-Month S&P 500 Index Implied Volatility minus 1-Month Realized Volatility of S&P 500. Source: Liquid Strategies and CBOE.
It is important to note that when looking at a more granular level, there are occasional quarters (roughly 10% of all quarters) that have a negative VRP due to short-term market shocks. While these short-term periods of negative VRP can create short-term losses for the Overlay and most option writing strategies, these periods of stress are critical to the long-term sustainability of the VRP. Without them, option writers would not be able to demand as high of a risk premium. As such, advisors and their clients that utilize our solutions have long-term views and consider short-term periods of stress as opportunities for the Strategy.
A common question from investors is how much longer can the market volatility stay so low? This a great question that has a very complex and uncertain answer. The best starting point for thinking about this is getting a historical perspective. Equity market volatility tends to move in long-term cycles, or regimes, between low volatility and high volatility, with these regimes typically lasting about 5 years. The current low volatility regime has extended past 7 years. Below is a chart for the annual average level of the CBOE S&P 500 Volatility Index (“VIX”):
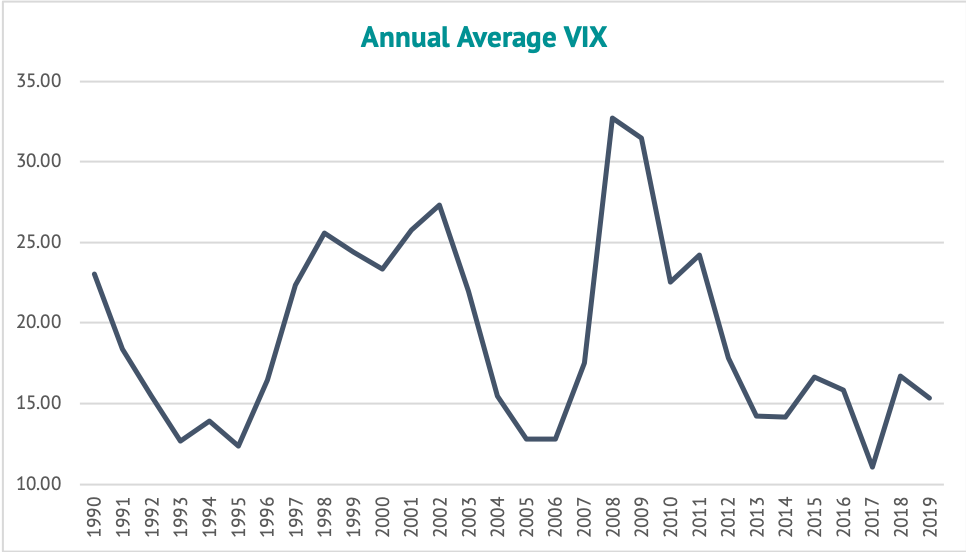 Source: CBOE, Liquid Strategies
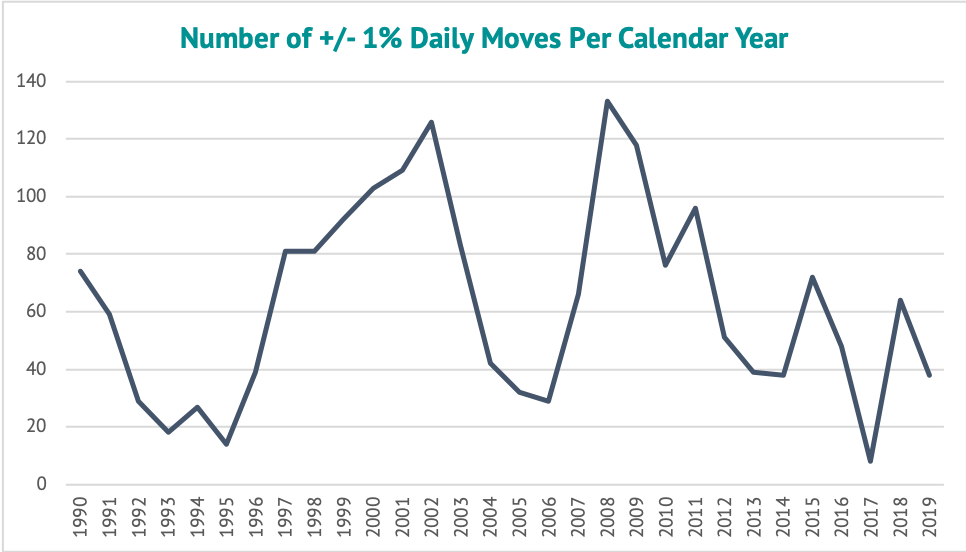
For perspective, a VIX level of 16 represents an expectation that the market will move about 1% a day. As the following charts illustrate, daily moves of 1% are in the minority of market moves. Since 1990, the S&P 500 Index has only averaged a daily move greater than 1% in 6 of the 30 years and the most 1% moves in a year were about 133. Furthermore, the number of days per year that the S&P 500 Index moves up or down by more than 1% is about 63 days per year (out of 252 trading days).
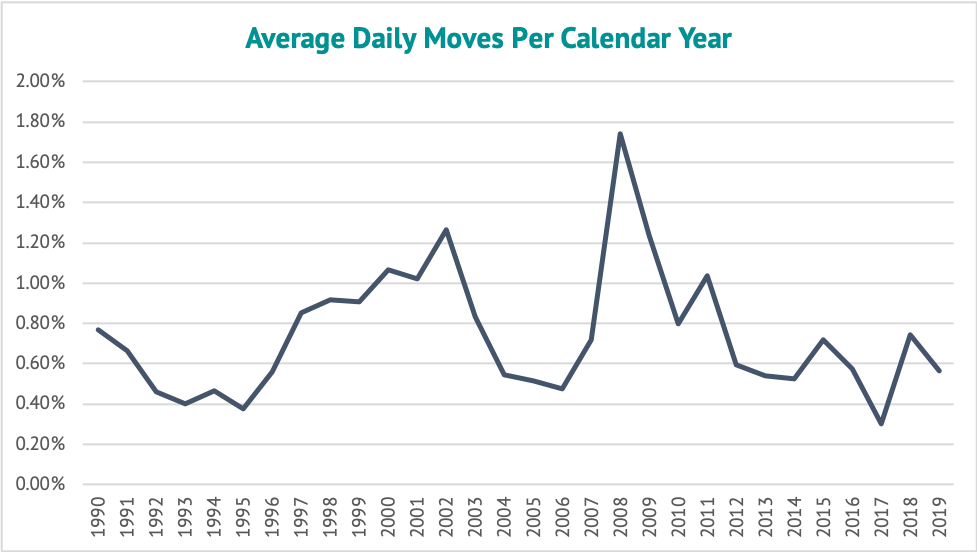 Source: Yahoo Finance, Liquid Strategies
 Source: Yahoo Finance, Liquid Strategies
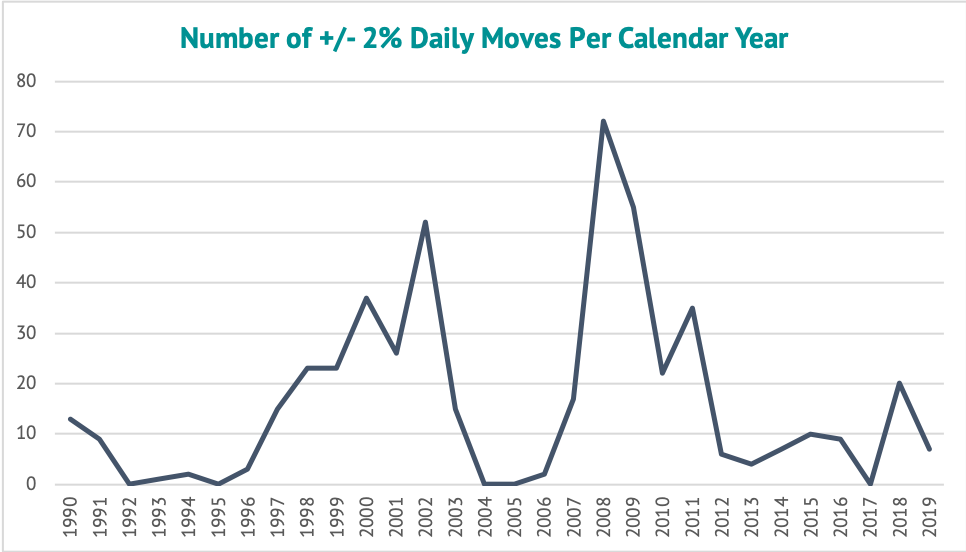
The factor that really drives the VIX Index to extreme levels are outsized daily moves of over 2%. As can be expected, 2008 had the most such moves at 72, while other years like 1992, 1995, 2004, 2005, and 2017 had 0.
 Source: Yahoo Finance, Liquid Strategies
Returning to the question at hand, the periods of higher volatility/ larger daily moves coincide with periods of high uncertainty, particularly economic uncertainty, and are usually associated with a recession. Any of the following factors (as well as a number of currently unknown ones) could increase the risk of a recession in the next 18 months, driving equity volatility higher along with it: 1) Global trade relations (particularly with China); 2) stability in the Middle East; 3) U.S. Presidential election; 4) slowing labor market and consumer/business confidence. While many investors may think the VIX is too low given these risk factors, the largest pricing input for the VIX, by far, is backward looking as opposed to forward looking.
As we move into the new decade, we look forward to doing our part in helping investors successfully navigate what will undoubtedly at times be a challenging investing environment for equities and bonds. As always, we appreciate your continued support and interest.
As always, we appreciate your continued support and interest.

Shawn Gibson, CIO, Portfolio Manager
Brad Ball, CEO, Portfolio Manager
Adam Stewart, CFA, Portfolio Manager
Justin Boller, CFA, Portfolio Manager
Learn more about Liquid Strategies and our process in our most recent White Papers, subscribe to our mailing list and visit liquidstrategiesllc.com


